

Introduction
AI/BI Dashboards and Genie are evolving at a breakneck pace. In this roundup, we’ll highlight the most impactful updates from the past three months that make AI/BI more powerful, easier to use, and smarter than ever.
For those unfamiliar, AI/BI is a suite of Business Intelligence (BI) capabilities that are included with the Databricks SQL product. Now is the perfect time to start if you haven’t explored it yet. With Databricks AI/BI, you can quickly and easily unlock and share insights from your data—without the need for a separate BI system.
Let’s take a closer look at the latest improvements!
What’s New?
Calculated Measures in Dashboards
Authors of AI/BI Dashboards can now create calculated measures to dynamically compute and visualize new metrics, such as profit margins or cost per mile, without altering the original dataset. This reduces the number of datasets in your dashboard, which improves dashboard performance and allows for cross-filtering across more visualizations.
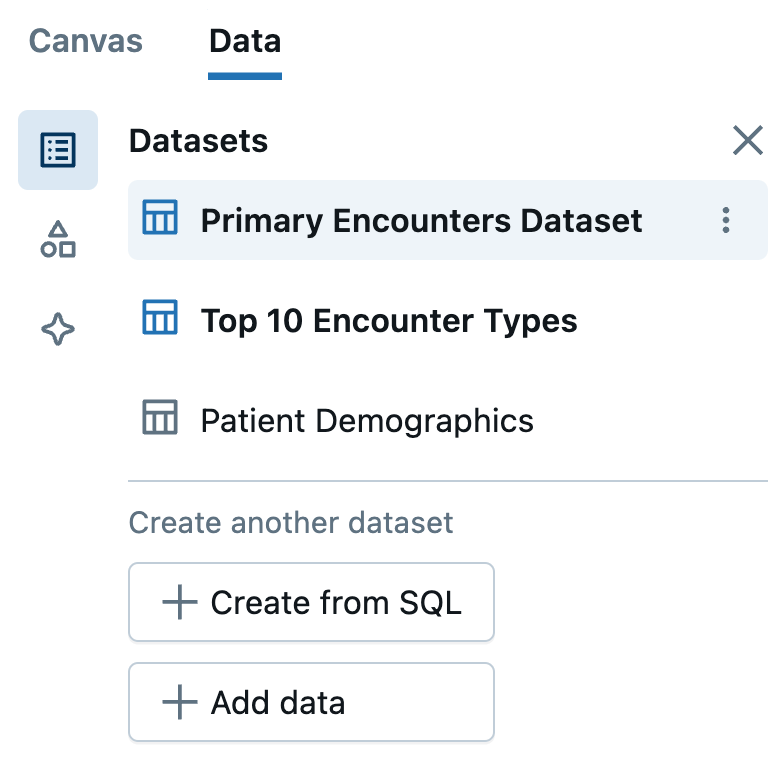
To create a calculated measure, navigate to the Data tab and select or create a dataset. Then, click the Calculated Measure button. Next, enter a name, description, and expression for your calculated measure. A key advantage of calculated measures is that they leverage existing ANSI SQL expression syntax, eliminating the need to learn a proprietary data modeling language.
Download dashboard as PDF
We also implemented one of our customers’ most frequently requested features—the ability to download any AI/BI Dashboard as a PDF document. Once the user selects the ‘Download as PDF’ option, the current dashboard page, along with any filters currently applied, will be downloaded.
Simplified user onboarding and dashboard sharing on Azure
As our recent blog post mentioned, we are thrilled to announce Automatic Identity Management, which provides a simplified way to onboard users and share AI/BI Dashboards with anyone in your Azure Entra-ID tenant. Automatic Identity Management is now in Gated Public Preview and enables instant, seamless and secure identity provisioning and sharing of dashboards with any Microsoft Entra ID user, group, or service principal in your organization’s tenant.
To learn more about Automatic Identity Management for Azure, check out our product documentation.
Clone a dashboard page
You can now clone a dashboard page (and no need to worry, this action does not duplicate the underlying datasets).
Cut/copy/paste widgets between pages
You can use keyboard shortcuts (cmd c/x/v) to cut or copy your widgets and paste them on another page. This action also does not duplicate the underlying dataset.
Reorder datasets
You can quickly reorder datasets using drag and drop.
Customize the sort order of your chart axis
And you can customize the sort order in which fields appear on your chart axis.
Easily identify which datasets are in use
You can also visually identify datasets that are in use by widgets on the canvas. Those actively used will be bolded with a blue icon, while those not in use will have a gray icon with a lighter font weight.
Enhanced Genie Visualizations
We’ve also been working hard to enhance the user experience within AI/BI Genie spaces. Notably, we recently updated the Genie visualization library to align with AI/BI Dashboards. Now, you can format visualizations just as you would in AI/BI Dashboards—changing the visual type, formatting and sorting chart axes, adjusting colors, tooltips, and more. Additionally, we’ve added the ability to resize visuals for improved readability.
We also taught Genie to automatically generate a visualization when it determines that a visual representation of the data would enhance clarity for the end user.
Finally, we added a quick way to show and hide a visualization directly from the Genie chat window.
To learn more about creating and maintaining AI/BI Genie spaces, refer to our product documentation.
Other notable features recently added to AI/BI
In addition to these key updates, we are continuously enhancing AI/BI Dashboards and Genie with an expanding set of features. This ongoing investment reflects our commitment to advancing AI/BI, making it easier for you to quickly uncover insights from your data and drive data-driven decision-making across your organization. Below are a few of our favorites, but please read the AI/BI product release notes for a full list of all the new features and fixes in AI/BI.
AI/BI Dashboards
- Pivot tables have undergone a major makeover, introducing several new features. Column header widths now automatically adjust based on the number of columns in each header, and cell content alignment can be customized for each measure. Sticky row and column headers ensure headers remain visible while scrolling, and multiple measures can now be displayed as either rows or columns.
- When cloning a legacy dashboard to an AI/BI dashboard, the migration tool now automatically attempts to convert Mustache syntax ({{param}}) to named parameter syntax (:param style). Additionally, it automatically converts multi-statement queries and queries that use the default catalog and schema picker in the SQL editor. You can read more about cloning legacy to AI/BI Dashboards here.
- We’ve enhanced the API to include scheduling and subscription management. You can also now use the API to publish dashboards with service principal credentials. See Use a service principal to publish and share dashboards.
- You can now link a dashboard to an existing Genie when you publish. For more details, see enable a Genie space from your dashboard.
- We also have several features in private preview. These include dashboard embedding for viewers without Databricks accounts and support for Git folders. Please contact your Databricks account team for details on how to participate in the preview.
AI/BI Genie
- Genie now leverages Chain-of-Thought reasoning to enhance text-to-SQL translation, breaking down queries into structured steps: identifying relevant columns, planning SQL generation, and assembling the final query. This upgrade improves SQL accuracy, leading to better filter selection and enhanced handling of complex queries.
- Improved query descriptions. Genie now leverages an updated model to generate more precise and accurate query descriptions.
- We have improved the handling of different Top K queries.
- We have added more relative datetime options, such as “Last 10 seconds” and “Last minute,” for datetime parameter controls. Additionally, we’ve introduced a “Now” option in date picker control widgets, making it easier to filter datetime values intuitively.
- AI/BI Genie now emits events to audit logs. This enables administrators to understand and analyze granular activity within the Genie space, such as who and when instructions were updated or when a user requests a review. For a full list of all Genie audit log events, please refer to the product documentation.
What’s Next for AI/BI?
As we look ahead, the AI/BI roadmap is filled with exciting enhancements aimed at improving product intelligence, usability, management, and the depth of analytics provided. Some of the key upcoming features to watch out for include:
AI/BI Dashboards
- We are introducing the ability to create calculated dimensions for your dashboards, similar to calculated measures. This feature allows you to define non-aggregated custom fields directly within your dashboards, eliminating the need for additional queries to the database. For example, a user could create a custom dimension called “Age Range” to categorize individual ages into predefined buckets for easier grouping and analysis.
- You will soon be able to add an AI/BI Dashboard as a Databricks Workflows task. This feature will make it easy to combine data pipeline refreshes with dashboard refreshes to support full end-to-end workflows with automatic dependency management and end-to-end monitoring.
- We will be adding global filters to ensure your filtering can be persisted as you move between different dashboard pages. We will also add the ability to specify widgets to be excluded from visualization filters. This is useful, for example, if a user wants to see which regions have average sales above or below the global average.
- Sankey visualizations will soon be added to AI/BI Dashboards. This popular visualization technique uses a flow diagram to depict how quantities move between different categories.
- You will soon be able to easily customize fonts, colors, and define your own color palettes in your dashboards.
- For Genie-enabled dashboards, viewers will soon be able to click on a specific chart and ask questions about it using natural language directly within the Genie chat window.
AI/BI Genie
- We will soon launch the Genie Conversation APIs into Public Preview, so watch out for a blog post coming in the next few weeks. Using the Conversation APIs, developers can programmatically interact with Genie to add its capabilities to custom-built apps or popular productivity tools like Microsoft Teams, Slack or Glean.
- Genie Value Indexing is also coming soon. This feature is currently in private preview, so please reach out to your account team if you want to participate. Genie value indexing enhances SQL accuracy by sampling values from string columns in order to give Genie the context needed to generate more precise and relevant queries. By incorporating sampled values, Genie can better understand what each column represents and how values are typically encoded in the data. For example, Genie will automatically know to use “CA” in the where clause when a user asks a question about California.
- Similar to the sharing model in AI/BI Dashboards, Genie admins will soon be able to share spaces with users and groups who are not members of the originating workspace.
Learn more about AI/BI
If you are ready to explore the latest in AI/BI, you can start by taking a free trial to get hands-on experience with the product. To learn more, you can also check out our documentation, visit our webpage, and watch the latest demos to see these features in action. And stay tuned—there’s even more innovation on the way!
