Superionic conducting mechanism
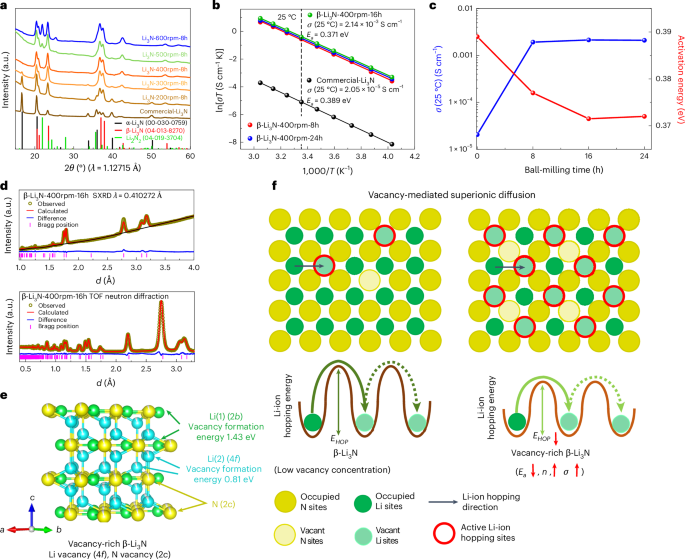
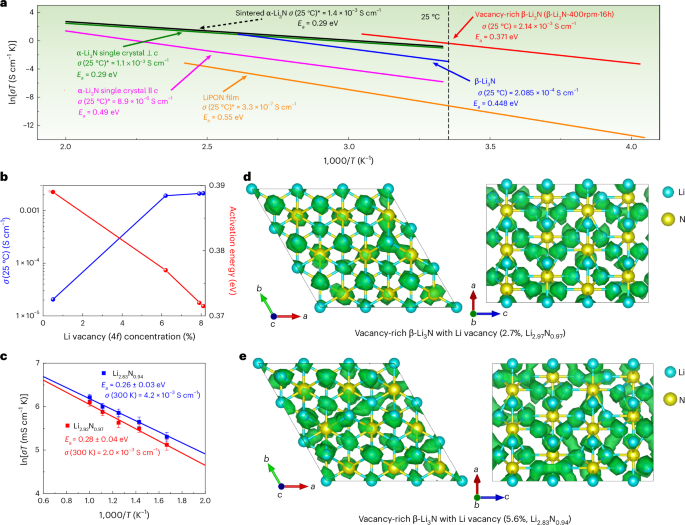
The ball-milling method is chosen to create high pressure for obtaining pure β-Li3N from the commercial mixed phased Li3N and a ball-milling speed of 400 rpm is chosen to prepare pure β-Li3N (Fig. 1a and Supplementary Note 1). Pure β-Li3N was obtained by ball milling at 400 rpm for 8 h, denoted by β-Li3N-400rpm-8h. The Arrhenius plots of the commercial Li3N and the β-Li3N-400rpm-8h are shown in Fig. 1b. The β-Li3N-400rpm-8h SSE demonstrated a high room-temperature (25 °C) ionic conductivity of 1.92 × 10⁻³ S cm−1, which is around two orders of magnitude higher than the commercial Li3N. The activation energy (0.377 eV) for the β-Li3N-400rpm-8h SSE is lower than that of commercial Li3N (that is, 0.389 eV). When the ball-milling time further increases from 8 h to 16 h and 24 h with a constant speed of 400 rpm, the ionic conductivity further increases. The corresponding β-Li3N SSEs prepared by different ball-milling times are denoted by β-Li3N-400rpm-16h and β-Li3N-400rpm-24h (Fig. 1b). A ball-milling time of 16 h leads to an optimized ionic conductivity of 2.14 × 10⁻³ S cm−1 at 25 °C and the lowest activation energy of 0.371 eV (Fig. 1c). The achieved ionic conductivity is among the highest values reported for not only pure Li3N but also all nitride SSEs so far (Fig. 2a), showing great promise to achieve high energy and power densities for all-solid-state lithium metal batteries21,34. In addition to the phase transformation, the improvement of ionic conductivity of the ball-milled β-Li3N compared with the commercial Li3N was related to the vacancy-mediated lithium-ion diffusion mechanisms27.
a, The XRD patterns of the Li3N samples processed by different ball-milling speeds (the ball-milling time was 8 h for all samples). The commercially available Li3N is usually a mixture of α- and β-phases. α-Li3N (space group P6/mmm) transforms into β-Li3N (space group P63/mmc) at an increased pressure. The ball-milling method (speed 400 rpm) is chosen to create high pressure for obtaining pure β-Li3N from the commercial mixed-phased Li3N. b, Arrhenius plots of β-Li3N as a function of the ball-milling time (the ball-milling speed is constant of 400 rpm) and commercial Li3N. The lithium-ion conductivity of Li3N is evaluated by the alternating current (a.c.) impedance method using pressed pellets. The plots compare the Arrhenius behaviour of commercial Li3N with β-Li3N samples milled at 400 rpm for varying durations (8 h, 16 h and 24 h). c, Lithium-ion conductivity at 25 °C and activation energy of β-Li3N plotted as functions of ball-milling duration, conducted at a consistent speed of 400 rpm. For comparison, commercial Li3N (without ball milling) is also presented. This figure summarizes the room-temperature ionic conductivities and activation energies as a function of ball-milling times. d, SXRD patterns and TOF neutron diffraction data (bank 3) with corresponding Rietveld refinement results for β-Li3N-400rpm-16h. The corresponding crystal structures with a focus on lithium and nitrogen vacancies are refined using the Rietveld method. e, Crystal structure of vacancy-rich β-Li3N and the calculated formation energy of single neutral lithium vacancy at 2b and 4f sites (2b site, 1.43 eV; 4f site, 0.81 eV), respectively. f, Schematic illustration of vacancy-mediated superionic diffusion mechanism of vacancy-rich β-Li3N. EHOP, lithium-ion hopping energy; Ea, activation energy for lithium-ion conduction; n, concentration of mobile lithium ions; σ, ionic conductivity.
a, Arrhenius plots of vacancy-rich β-Li3N (that is, β-Li3N-400rpm-16h) and other nitrides (α-Li3N single crystals39, α-Li3N sinter26, β-Li3N27 and LiPON film42) for comparison. The room-temperature (25 °C) ionic conductivity is calculated based on Arrhenius plots. For α-Li3N single crystals, the anisotropic lithium-ion conductivities parallel and perpendicular to the hexagonal c axis are presented, denoted as α-Li3N single crystal || c, and α-Li3N single crystal ⊥ c, respectively. b, Lithium-ion conductivity at 25 °C and activation energy of vacancy-rich β-Li3N as a function of lithium vacancy concentration (4f sites). c, Arrhenius plots of lithium-ion diffusivity in vacancy-rich β-Li3N with different lithium vacancy concentrations in AIMD simulations. The vacancy concentration is 2.7% for Li2.92N0.97 and 5.6% for Li2.83N0.94. Statistical deviations in lithium-ion diffusivity were evaluated due to the stochastic nature of ion hopping, with error bars representing standard deviations calculated from the total diffusional displacements and effective ion hops observed in AIMD simulations. d,e, Lattice structures and superimposed lithium-ion probability density (marked by green iso-surfaces) in vacancy-rich β-Li3N with different lithium vacancy concentrations, 2.7% in Li2.92N0.97 (d) and 5.6% in Li2.83N0.94 (e), based on AIMD simulations at 600 K.
The crystal structures of commercial Li3N and ball-milled β-Li3N studied by SXRD and TOF neutron diffraction with a focus on lithium and nitrogen vacancies were refined using the Rietveld method, as shown in Fig. 1d,e, Supplementary Figs. 1–4 and Supplementary Tables 1–8. The commercial Li3N was determined as a mixture of 63.1(9) wt% α-phase and 36.9(7) wt% β-phase, and the refined crystal structures of the α- and β-phases are shown in Supplementary Fig. 1. In the commercial Li3N, the Li(1) sites in the α-phase (1b) and the β-phase (2b) are fully occupied. Conversely, the Li(2) sites (2c in α-phase; 4f in β-phase) and N(3) sites (1a in α-phase; 2c in β-phase) are partially occupied. Subsequent calculations reveal that the lithium and nitrogen vacancy concentrations for both phases in the commercial Li3N are minimal: 0.7(4)% at the Li(2) 2c site (amounting to 0.5(4)% across all lithium sites) and 0.5(2)% at the N(3) 1a site in the α-phase, and 0.5(4)% at the Li(2) 4f site (equivalent to 0.3(4)% across all lithium sites) and 0.3(2)% at the N(3) 2c site in the β-phase. In the case of the β-Li3N-400rpm-8h sample, the purely constituted β-Li3N demonstrated an augmented lithium vacancy concentration at the 4f site, approximately 6.2(6)% (translating to 4.1(6)% across all lithium sites) as indicated in Supplementary Fig. 2 and Supplementary Tables 3 and 4. The lithium and nitrogen vacancy concentrations in the vacancy-rich β-Li3N generally escalated with prolonged ball-milling durations, yet plateaued post 16 h. Specifically, the β-Li3N-400rpm-16h sample, hereinafter referred to as vacancy-rich β-Li3N, showcased peak vacancy concentrations, with lithium vacancies approximated at 8.1(2)% at the Li(2) 4f sites (around 5.4(2)% for all lithium sites) and nitrogen vacancies at roughly 5.4(1)% at the N 2c sites (Fig. 1e). The presence of lithium vacancies at the 4f sites, rather than the 2b sites, can be attributed to the comparatively weaker bonding between N3− and Li+ at the 4f sties, as well as the low lithium vacancy formation energy at the 4f site compared with the 2b site (Fig. 1e and Supplementary Note 2).
Apparent correlations can be concluded that the higher lithium and nitrogen vacancy concentrations can lead to a higher concentration of mobile lithium ions, lower lithium-ion diffusion barriers (that is, lower activation energy) and thus higher ionic conductivity as shown in Figs. 1f and 2b, Supplementary Fig. 5 and Supplementary Note 3. The lithium diffusion mechanism in vacancy-rich β-Li3N with different concentrations of lithium and nitrogen vacancies was further studied by AIMD simulation. When vacancies were introduced, fast ionic conduction was observed in a three-dimensional channel as shown in Fig. 2d,e. The faster ionic conduction was achieved for β-Li3N with the increased vacancy concentration in AIMD simulations (Fig. 2c). When total vacancy concentrations increased from 2.7% to 5.6% in vacancy-rich β-Li3N, the activation energy decreased from 0.28 ± 0.04 eV to 0.25 ± 0.03 eV with extrapolated lithium-ion conductivity increased from 2.0 × 10⁻³ S cm−1 to 4.2 × 10⁻³ S cm−1 at 300 K. The result of accelerated lithium-ion diffusion in the crystal lattice by vacancies is consistent with our experimental results that the ionic conductivity increased from 2.05 × 10⁻⁵ S cm−1 to 2.14 × 10⁻³ S cm−1 when vacancy concentration increased from 0.5% to 8.1% at Li(2) 4f sites (from 0.3(4)% to 5.4(2)% for total lithium sites). The observed enhancement in lithium-ion diffusion within the crystal lattice, attributed to the presence of vacancies, agrees with the experimental results. Specifically, the ionic conductivity increases from 2.05 × 10⁻⁵ S cm−1 to 2.14 × 10⁻³ S cm−1 as the vacancy concentration at the Li(2) 4f sites increased from 0.5% to 8.1% (translating to an increase from 0.3(4)% to 5.4(2)% across all lithium sites). According to the DFT calculations, the formation energy of vacancy-rich β-Li3N across varying concentrations increases from 1.25 eV for Li2.92N0.97 (vacancy concentration 2.7%) to 2.67 eV for Li2.83N0.94 (vacancy concentration 5.6%) and 5.44 eV for Li2.67N0.89 (vacancy concentration 11.1%) (Supplementary Fig. 6). This high formation energy for the vacancy-rich β-Li3N may explain the limit for the achievable vacancy concentration observed in our experimental sample, which exhibited a vacancy concentration of approximately 5.4%. A deeper analysis with scanning electron microscopy (SEM) probing the interrelationship between lithium-ion diffusion, particle size and vacancy concentration pinpoints an elevated vacancy concentration as a crucial determinant of enhanced lithium-ion diffusion within the β-Li3N SSEs (Supplementary Fig. 7 and Supplementary Note 4).
Chemical stability towards lithium metal and air
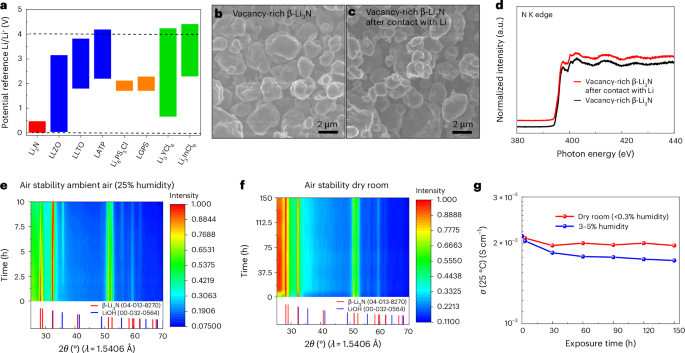
According to the calculations (Fig. 3a and Supplementary Fig. 8), almost all well-known SSEs are unstable with lithium metal owing to the reduction of central cations. By contrast, only vacancy-rich β-Li3N is stable against lithium metal anode and shows a stable electrochemical window of 0–0.48 V. Meanwhile, as shown in Supplementary Fig. 9, the time-resolved electrochemical impedance spectroscopy (EIS) spectra of the Li/vacancy-rich β-Li3N/Li symmetric cell remained almost unchanged for 30 h, confirming the thermodynamic stability of vacancy-rich β-Li3N towards lithium metal. SEM images, depicted in Fig. 3b,c, show the morphology of pristine and lithium-interacted vacancy-rich β-Li3N, revealing minimal morphological changes and suggesting an absence of surface reactions with lithium metal. Ex situ X-ray absorption near-edge structure (XANES) analysis further corroborates the stability of vacancy-rich β-Li3N SSE against lithium, as illustrated in Fig. 3d. The N K-edge XANES spectrum characterizes electron transitions from nitrogen’s 1s orbital to the vacant electronic states in the conduction band, with a notable peak at approximately 398 eV indicative of 1s to π* transitions and broader peaks around 400 eV and 403 eV corresponding to 1s to σ* transitions35,36. The consistency of nitrogen K-edge XANES spectra before and after lithium contact underscores the SSE’s substantial chemical stability towards lithium metal. Enhanced spatial resolution XANES spectra through STXM, shown in Supplementary Fig. 10a,b, further validate these findings, showing the preserved particle morphology of vacancy-rich β-Li3N upon lithium interaction. These STXM images, captured at the pre-edge of the N K-edge absorption (395 eV), and the nitrogen K-edge XANES spectra derived from the surface of β-Li3N particles post-lithium contact (data were collected at photon energies spanning from 395 eV to 418 eV (refs. 37,38); Supplementary Fig. 10c), exhibit no notable chemical changes, affirming the material’s resistance to reactions with lithium. The consistency across various surface locations of a β-Li3N particle (Supplementary Fig. 10b) reinforces the absence of surface reactions, with only minor spectral fluctuations attributed to the STXM technique’s photon energy resolution limits.
a, Calculated thermodynamics intrinsic electrochemical windows of vacancy-rich β-Li3N and other common SSEs, including oxides (that is, La3Li7O12Zr2 (LLZO), 0.03–3.16 V; lithium lanthanum titanate (LLTO), 1.80–3.73 V; Li1.3Al0.3Ti1.7(PO4)3 (LATP), 2.19–4.20 V), sulfides (that is, Li10GeP2S12 (LGPS), 1.71–2.29 V; Li6PS5Cl, 1.71–2.13 V) and halides (that is, Li3YCl6, 0.65–4.25 V; Li3InCl6, 2.28–4.42 V). b,c, SEM images of the vacancy-rich β-Li3N (b) and the vacancy-rich β-Li3N sample after contact with lithium (c). d, Normalized nitrogen K-edge XANES spectra of pristine vacancy-rich β-Li3N and the vacancy-rich β-Li3N sample after contact with lithium. N K-edge XANES spectra were collected in the TEY mode. e, Operando XRD pattern evolution of vacancy-rich β-Li3N during the exposure process to air with 25% relative humidity for 10 h, acquired at 30 min intervals over a 10 h period. f, In situ XRD pattern evolution of vacancy-rich β-Li3N upon different exposure times in a dry room with a low dew point of −50 °C to −60 °C (<0.3% relative humidity) for 150 h. Notably, the broad hump at approximately 26 degrees 2θ corresponds to the Kapton tape used in the sample preparation, which does not exhibit distinct sharp XRD peaks. g, The lithium-ion conductivity evolution at 25 °C of vacancy-rich β-Li3N after different exposure times in a dry room with a low dew point of −50 °C to −60 °C (<0.3% relative humidity) and ambient air with 3–5% humidity level for 150 h.
Beyond its thermodynamic stability against lithium metal, the air stability of vacancy-rich β-Li3N stands as another essential trait for practical handling. To assess the air stability of the vacancy-rich β-Li3N sample upon atmospheric exposure, we used operando and in situ X-ray diffraction (XRD) combined with ex situ soft X-ray XANES techniques, targeting both the N K-edge and O K-edge. These methods were chosen given that XRD offers sensitivity to crystal structures, while soft X-ray XANES collected in the total electron yield (TEY) mode provides insights into surface chemistry. Figure 3e and Supplementary Fig. 11 depict operando XRD results for the vacancy-rich β-Li3N sample when exposed to ambient air with a relative humidity of 25%. Notably, the emergence of LiOH impurity was observed approximately 1–1.5 h post air exposure, attributable to its interaction with atmospheric moisture, as inferred from the operando XRD and ex situ XANES studies (Supplementary Figs. 11a and 12). After the 10 h exposure duration, the dominant β-Li3N phase remained largely intact, accompanied by a consistent proportion of the LiOH impurity. It is postulated that the formation of LiOH acted as a protective barrier, limiting the further exposure of β-Li3N to moisture, as corroborated by the operando XRD and ex situ XANES analyses (Supplementary Figs. 11a and 12). Analogous observations have been documented for α-Li3N single crystals39. The chemical resilience of the vacancy-rich β-Li3N sample under dry rooms (dew points −50 °C to −60 °C, equivalent to <0.3% relative humidity) is ascertained via in situ XRD and ex situ XANES. Figure 3f and Supplementary Fig. 11b show the in situ XRD data for samples stored for up to 150 h in a dry room environment. Noteworthy is the broad hump around 26 degrees 2θ, attributed to Kapton tape used during sample preparation, absent of distinct, sharp XRD peaks. Notably, these samples consistently exhibited the β-Li3N phase with uniform peak intensities and showed no additional peaks suggestive of crystalline LiOH or other secondary crystalline phases. Furthermore, the ex situ XANES data, depicted in Supplementary Fig. 12c,d (Supporting Information), verify the presence of the LiOH layer on the β-Li3N surface. This LiOH layer likely acts as a protective barrier, mitigating further exposure of the β-Li3N to moisture. Figure 3g compares the lithium-ion conductivity of vacancy-rich β-Li3N at 25 °C after different atmospheric/humidity exposures. High ionic conductivities above 10−3 S cm−1 were maintained after different exposure conditions, even for the sample exposed to 3–5% humidity for 150 h. The findings indicate that β-Li3N exhibits stability under conditions of low humidity, both in a dry room environment and during prolonged storage, rendering it suitable for integration into large-scale industrial manufacturing processes. However, exposure to high-humidity environments and direct contact with water present potential hazards for this vacancy-rich β-Li3N. To mitigate these safety concerns, it is advisable to implement coating strategies designed to minimize risks40. The criteria for selecting appropriate coating materials include compatibility with vacancy-rich β-Li3N, resistance to moisture intrusion, high ionic conductivity and minimal electronic conductivity.
All-solid-state lithium metal batteries
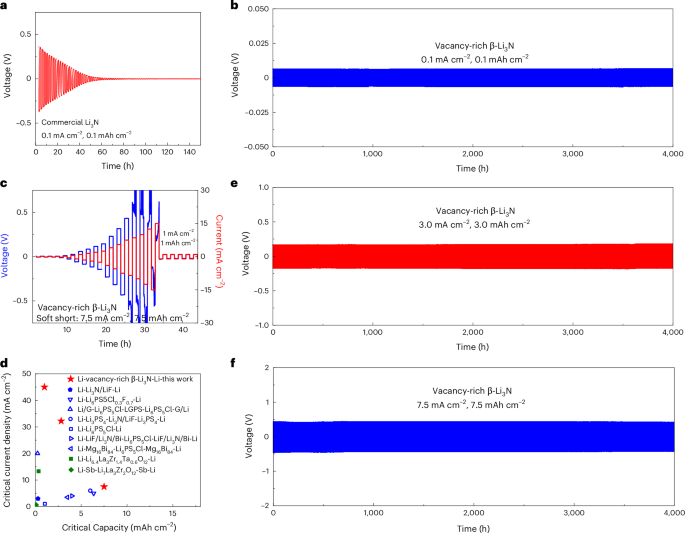
Determined by the direct current polarization method (Supplementary Fig. 13), this vacancy-rich Li3N shows a low electronic conductivity of ~4.5 × 10⁻¹⁰ S cm−1, which was promising to ensure stable lithium stripping and plating behaviour even at high current densities and capacities (Supplementary Note 5). All-solid-state lithium symmetric cells were fabricated to investigate the lithium stripping and plating behaviours, as depicted in Supplementary Fig. 14. To assess the performance of commercially available Li3N, an all-solid-state Li/commercial-Li3N/Li symmetric cell was evaluated at current densities and capacity of 0.1 mA cm−2 and 0.1 mAh cm−2. Figure 4a reveals an initial overpotential of approximately 0.5 V, attributable to the low ionic conductivity (specifically, 2.05 × 10⁻⁵ S cm−1). In subsequent stripping/plating cycles, this overpotential rapidly decreased to nearly 0 V within 80 h, suggesting serious lithium dendrite growth within the commercial Li3N SSE layer and a heightened propensity for short-circuiting. In stark contrast, the all-solid-state Li/vacancy-rich β-Li3N/Li symmetric cell showcased outstanding electrochemical performance under identical cycling conditions. Figure 4b and Supplementary Figs. 15, 16 and 17a elucidate that both the initial overpotential and the EIS spectra of this symmetric cell remained consistent even after 4,000 h of cycling. Figure 4c demonstrates the cell’s stable potential profiles, enduring a notable current density up to 7.5 mA cm−2 and a commendable capacity of 7.5 mAh cm−2. While the overpotential profiles manifested fluctuations between 7.5 and 15 mA cm−2 – which suggests potential lithium dendrite formation under these rigorous conditions – the consistent subsequent stripping/plating performance at 1 mA cm−2 and 1 mAh cm−2 indicated the non-existence of a hard short circuit. The Li/vacancy-rich β-Li3N/Li symmetric cell showcased a transient adaptability to heightened current densities and capacities, withstanding up to 15 mA cm−2 and 15 mAh cm−2, respectively41. After this rigorous assessment, continuous cycling at 1 mA cm−2 and 1 mAh cm−2 continued for 3,000 h, as presented in Supplementary Fig. 18. Analyses via EIS, XANES and SEM analyses collectively further confirm the exceptional stability under high current densities, as evident in Supplementary Fig. 9 and Supplementary Note 6. For preset critical capacities of 1 mAh cm−2 and 3 mAh cm−2, peak critical current densities of 45 mA cm−2 and 32.5 mA cm−2 were documented, as illustrated in Supplementary Figs. 18 and 19. Compared with existing all-solid-state lithium symmetric cells utilizing sulfide, nitride and oxide SSEs, and interlayer design, the Li/vacancy-rich β-Li3N/Li symmetric cell exhibited substantial enhancements in critical current densities and cycling capacities, as concisely illustrated in Fig. 4d. For the pursuit of high energy and power densities, extended lithium stripping/plating cycling was evaluated at various conditions. Figure 4e,f and Supplementary Fig. 15 demonstrate that the Li/vacancy-rich β-Li3N/Li symmetric cells maintained consistent cycling performance over 4,000 h at both 3 mA cm−2 (capacity 3 mAh cm−2) and 7.5 mA cm−2 (capacity 7.5 mAh cm−2). In addition, Supplementary Figs. 17 and 19 showcase thinner layers of vacancy-rich β-Li3N (15 mg, approximately 0.25 mm), highlighting the importance of minimizing overpotential in the Li/vacancy-rich β-Li3N/Li symmetric cells for practical application in full cells. The cells exhibited low overpotentials and sustained cycling performance across 750 h at current densities of 0.1 mA cm−2 (capacity 0.1 mAh cm−2) and 7.5 mA cm−2 (capacity 7.5 mAh cm−2), and stable cycling through 500 cycles at 45 mA cm−2 (capacity 1 mAh cm−2) and 32.5 mA cm−2 (capacity 3 mAh cm−2), along with stable cycling over 500 cycles at both 45 mA cm−2 (and 1 mAh cm−2) and 32.5 mA cm−2 (and 3 mAh cm−2). Furthermore, Supplementary Fig. 20 showcases the remarkable cycling stability of the Li/vacancy-rich β-Li3N/Cu asymmetric all-solid-state cells across 1,000 cycles at various conditions: 0.1 mA cm−2 and 0.1 mAh cm−2, 3 mA cm−2 and 3 mAh cm−2, and finally, at 7.5 mA cm−2 and 7.5 mAh cm−2.
a,b, Voltage profiles of Li/commercial-Li3N/Li (a) and Li/vacancy-rich β-Li3N/Li (b) symmetric all-solid-state cells with a current density of 0.1 mA cm−2 and a fixed capacity of 0.1 mAh cm−2. c, Voltage profiles of the Li/vacancy-rich β-Li3N/Li symmetric all-solid-state cell with incremental current densities and capacities (lithium plating/stripping for fixed 1 h) followed by a fixed current density of 1 mA cm−2 and a fixed capacity of 1 mAh cm−2. Given the paramount importance of critical current densities and capacity in achieving elevated energy and power densities, the symmetric cell underwent assessment with progressively increasing current densities, all the while preserving a constant stripping/plating duration of 1 h. d, Comparison of the critical current densities and capacity for lithium symmetric cells of this work and other reports using sulfide-, oxide- and nitride-based SSEs: Li-Li6PS5Cl0.3F0.7-Li43, Li/G-Li6PS5Cl-LGPS-Li6PS5Cl-G/Li2, Li-Li3PS4-Li3N/LiF-Li3PS4-Li33, Li-Li3N/LiF-Li33, Li-Li6PS5Cl-Li12, Li-LiF/Li3N/Bi-Li6PS5Cl-LiF/Li3N/Bi-Li18, Li-Mg16Bi84-Li6PS5Cl-Mg16Bi84-Li19, Li-Li6.4La3Zr1.4Ta0.6O12-Li44, Li-Sb-Li7La3Zr2O12-Sb-Li45. e,f, Voltage profiles of the Li-vacancy-rich β-Li3N-Li symmetric all-solid-state cell with a current density of 3 mA cm−2 and a fixed capacity of 3 mAh cm−2 (e) and a current density of 7.5 mA cm−2 with a fixed capacity of 7.5 mAh cm−2 (f). Data presented in this figure were obtained using all-solid-state pellet-type cells.
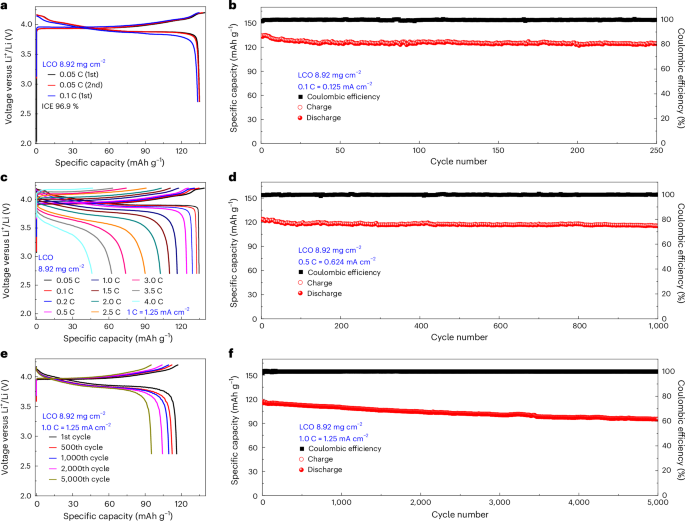
All-solid-state lithium metal batteries were fabricated with LiCoO2 (LCO) and Ni-rich LiNi0.83Co0.11Mn0.06O2 (NCM83) serving as cathodes. Halide SSEs, Li3InCl6 and Li3YCl6, were paired with this vacancy-rich β-Li3N to form the SSE layer, while lithium metal constituted the anode, resulting in LCO or NCM83/Li3InCl6/Li3YCl6/vacancy-rich β-Li3N/Li full cells (Supplementary Figs. 14 and 21, and Supplementary Note 7). The LCO/Li3InCl6/Li3YCl6/vacancy-rich β-Li3N/Li full cells with an LCO loading of 8.92 mg cm−2 exhibit stable cycling performance (Fig. 5 and Supplementary Fig. 22). The full cell exhibited an impressive initial discharge capacity of 139.2 mAh g−1 coupled with a high initial Coulombic efficiency (ICE) of 96.9% at a rate of 0.05 C. At a rate of 0.1 C, the cell achieved a reversible capacity of 133.3 mAh g−1 and maintained an elevated Coulombic efficiency of 99%. Notably, the discernible phase-transition-induced voltage plateaus alluded to minimal polarization, ensuring efficient Li⁺ ion transport across the LCO and SSE interface. As depicted in Fig. 5c, at cycling rates of 0.5 C, 1.0 C, 2.0 C, 3.0 C and 4.0 C, the reversible capacities were sustained at 124 mAh g−1, 116 mAh g−1, 102 mAh g−1, 73 mAh g−1 and 46 mAh g−1, respectively. The compatibility of the lithium metal with the vacancy-rich β-Li3N layer is further underscored by the prolonged cycling life of the full cell, as illustrated in Fig. 5b,d–f. When subjected to a cycling rate of 0.1 C, the cell demonstrated consistent capacity retention, delivering 124 mAh g−1 across 250 cycles. At higher current densities of 0.5 C and 1.0 C, excellent long-term cycling stability with high reversible capacity (115.5 mAh g−1 over 1,000 cycles at 0.5 C and 95.21 mAh g−1 over 5,000 cycles at 1.0 C) and high capacity retention (93.6% over 1,000 cycles at 0.5 C and 82.05% over 5,000 cycles at 1.0 C) were demonstrated. Supplementary Fig. 22 (Supporting Information) illustrates the average cycling performance at rates of 0.1 C, 0.5 C and 1.0 C across ten cells for each condition, confirming the reproducibility and robustness of the all-solid-state lithium metal cells’ performance.
Long-term electrochemical performance of the LCO/Li3InCl6/Li3YCl6/vacancy-rich β-Li3N/Li all-solid-state lithium metal batteries with an LCO loading of 8.92 mg cm−2 at 25 °C with an operating voltage window between 4.2 V and 2.7 V. a,c,e, The charge/discharge curves at 0.05 C and 0.1 C (a) and incremental cycling rates up to 4.0 C (c) and 1.0 C (e) (for the 1st, 500th, 1,000th, 2,000th and 5,000th cycles). b,d,f, Charge–discharge capacity and the Coulombic efficiency as a function of cycle number for all-solid-state lithium metal batteries cycled at 0.1 C (b), 0.5 C (d) and 1.0 C (f). Data presented in this figure were obtained using all-solid-state pellet-type cells.
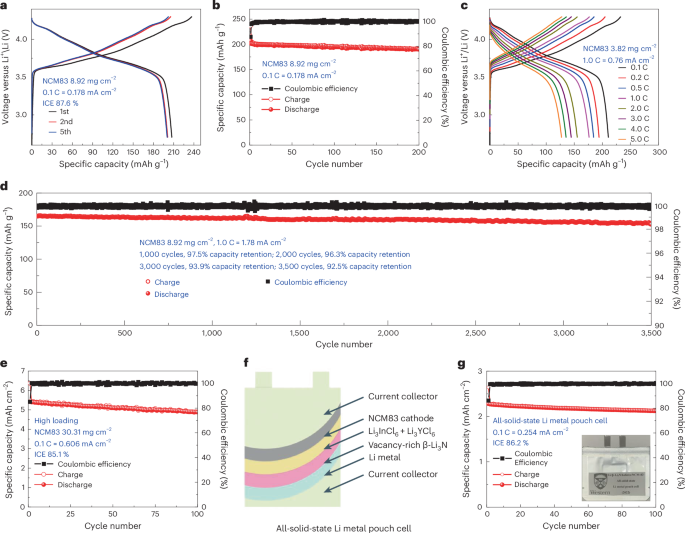
Figure 6a presents the voltage profiles of the NCM83/Li3InCl6/Li3YCl6/vacancy-rich β-Li3N/Li full cells at a rate of 0.1 C (where 1 C = 200 mA g−1). The ICE registers at 87.6%, and the Coulombic efficiency of subsequent cycles approaches approximately 100%, as depicted in Fig. 6b, Supplementary Fig. 23 and Supplementary Note 8. The reversible capacity of full cells was ~207 mAh g−1 and then maintained at ~195 mAh g−1 and ~190 mAh g−1 over 100 and 200 cycles, respectively. Another full cell with an NCM83 loading of 3.82 mg cm−2 achieved fast charging and discharging performance up to 5.0 C and can reach 83.77%, 73.90%, 68.63%, 64.31% and 60.47% of the reversible capacity at 1.0 C, 2.0 C, 3.0 C, 4.0 C and 5.0 C, respectively (Fig. 6c and Supplementary Fig. 24). We also demonstrated ultra-long cycling life of all-solid-state lithium metal batteries as shown in Fig. 6d. At 1.0 C, the full cell presented a high reversible capacity of ~142 mAh g−1 and an ultra-high capacity retention of 92.5% over 3,500 cycles, suggesting high chemical stability and high compatibility of vacancy-rich β-Li3N layers to lithium metal during long cycling life. The full cells with a substantial NCM83 loading of 30.31 mg cm−2 exhibited an impressive initial areal capacity of 5.42 mAh cm−2. They achieved a commendable ICE of 85.1% and sustained a robust areal capacity of approximately 4.88 mAh cm−2 over 100 cycles (Fig. 6e). Supplementary Fig. 25 details the average cycling performance of full cells with an NCM83 loading of 8.92 mg cm−2 at 0.1 C and 1.0 C, as well as those with a high areal loading of 30.31 mg cm−2, based on testing 10 cells for each cycling condition, demonstrating high reproducibility for the all-solid-state lithium metal cells. Given the pragmatic demands of electric vehicles (EVs), all-solid-state lithium metal pouch cells emerge as a potent approach, aiming for an elevated energy density (approaching 500 Wh kg−1) and ensuring an extended driving range (surpassing 300 miles) for EVs. All-solid-state lithium metal pouch cells are fabricated through the dry-film technique (Fig. 6f,g and Supplementary Fig. 26). Notably, this all-solid-state lithium metal pouch cell presented a remarkable ICE of 86.2% and sustained a capacity nearing 2.11 mAh cm−2 across 100 cycles. The average cycling performance of these all-solid-state pouch cells, demonstrating their high reproducibility, is documented in Supplementary Fig. 25.
Long-term electrochemical performance of the NCM83/Li3InCl6/Li3YCl6/vacancy-rich β-Li3N/Li all-solid-state lithium metal batteries at 25 °C with an operating voltage window between 4.3 V and 2.7 V and the NCM83 loading of 8.92 mg cm−2 and 3.82 mg cm−2. a,c, The charge/discharge curves at 0.1 C (a) and incremental cycling rates up to 5.0 C (c). b,d, Charge–discharge capacity and the Coulombic efficiency as a function of cycle number for all-solid-state lithium metal batteries cycled at 0.1 C (b) and 1.0 C (d). e, Charge–discharge capacity and Coulombic efficiency as a function of cycle number of high loading all-solid-state lithium metal batteries performance (areal loading of NMC83, 30.31 mg cm−2; initial reversible areal capacity, 5.42 mAh cm−2). Data presented in a–e were obtained using all-solid-state pellet-type cells. f,g, Schematic (f) and charge–discharge capacity and Coulombic efficiency (g) as a function of cycle number of an all-solid-state pouch cell with a high areal capacity (initial reversible areal capacity 2.28 mAh cm−2). The dry-film technique is adopted to construct these all-solid-state lithium metal pouch cells. An NCM83 cathode film is developed, encompassing a mixture of NCM83 and Li3InCl6 SSE, and offering a reversible areal capacity of around 2.28 mAh cm−2. Halide SSE films, integrating Li3InCl6 and Li3YCl6 SSEs, alongside a vacancy-rich β-Li3N film, are fabricated as detailed in Supplementary Fig. 27. These crafted components were systematically layered and pressurized together with a lithium metal foil, culminating in a comprehensive all-solid-state full cell. This meticulously assembled full cell was then hermetically sealed within an aluminium pouch in a vacuum environment, showcased in g.
The stable electrochemical performance observed in all-solid-state lithium metal batteries can be attributed to several key factors: the outstanding structural resilience and lithium metal compatibility of the vacancy-rich β-Li3N SSE throughout the electrochemical cycling, the robust interfacial stability within the layered SSE architecture and the effective compatibility of Li3InCl6 with the used cathode materials. The structural stability of this vacancy-rich β-Li3N SSE during electrochemical cycling is confirmed by ex situ SXRD, XANES, SEM and EDX mapping results, as depicted in Supplementary Figs. 27–38, Supplementary Tables 9–12 and Supplementary Note 9. To further extend the study’s scope to a broader range of applications, additional commercially available SSEs such as Li6PS5Cl are investigated. In all-solid-state lithium metal battery configurations comprising LCO or NCM83/Li6PS5Cl/LYC/β-Li3N/Li, remarkable electrochemical stability is observed at both 0.1 C and 1 C cycling rates as shown in Supplementary Fig. 39 and Supplementary Note 10. To address the critical requirement for air stability in SSEs for practical applications, the vacancy-rich β-Li3N SSEs, after exposure to ambient air for 10 h (hereafter referred to as β-Li3N-air-10h), still exhibit high lithium-ion diffusion characteristics, good electrochemical performance and robust interfacial stability, as depicted in Supplementary Figs. 40–43 and Supplementary Note 11. Considering cost as a critical factor for practical application, the expense associated with β-Li3N SSE has been evaluated against that of other conventional sulfide, halide and oxide SSEs, as depicted in Supplementary Fig. 44. This comparison reveals that the cost of β-Li3N SSE is on par with that of widely used commercial SSEs, such as Li6PS5Cl, Li3InCl6, La3Li7O12Zr2 (LLZO) and Li6.4La3Zr1.4Ta0.6O12 (LLZTO). Furthermore, it is anticipated that the cost of β-Li3N SSE could decrease substantially with the adoption of large-scale manufacturing processes, underscoring its potential viability for the battery industry at large. In summary, the demonstrated high ionic conductivity at ambient temperature, exceptional cycling performance, substantial interfacial stability and low cost together highlight the remarkable air stability and vast potential for practical applications of the vacancy-rich β-Li3N SSE.


