Synthesis and characterization of bioactive TPSF material with ROS-scavenging ability
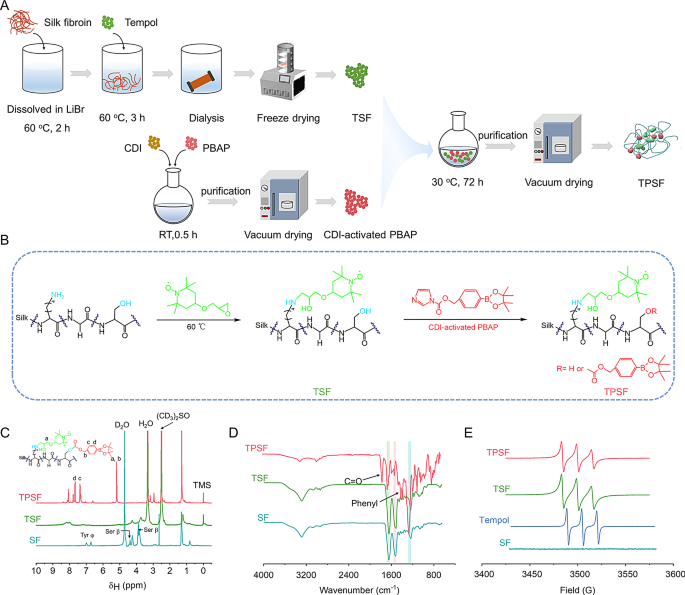
Tpl is a SOD-mimetic agent that can effectively neutralize superoxide anions and oxygen radicals [65]. Meanwhile the PBAP unit is able to stoichiometrically inactivate H2O2 [41]. Thus, we designed a silk-based ROS scavenger, defined as TPSF, which was simultaneously chemically modified with both Tpl and PBAP units. We hypothesize that nanomaterials based on TPSF could serve as candidates for targeted therapy of acute inflammatory diseases by restoring the redox balance in the pathological microenvironment. The synthetic process of TPSF is illustrated in Fig. 1A and B. Specifically, TPSF was synthesized via Tpl substitution of the primary amines of SF in an alkaline environment, followed by modification with CDI-activated PBAP on the hydroxyl groups of SF. According to a previously reported study [59], Tpl-conjugated SF (TSF) materials were fabricated with a final Tpl concentration of 282 mmol/L. For PBAP modification, the mass ratios of TSF to CDI-PBAP and the reaction time were determined based on H2O2 scavenging efficiency and 1H NMR spectra (Fig. S1A, B), resulting in a 1:8 ratio for TPSF synthesis over a 72 h reaction period. The 1H NMR spectra of TPSF indicated the characteristic signals at about 7.4 and 7.7 ppm, which were assigned to the phenyl groups of PBAP (Fig. 1C). Of note, the proton signals at approximately 4.0, 4.4, 6.7, and 7.0 ppm were significantly reduced or even disappeared after modification with the active units, suggesting that the active units were covalently grafted onto the serine and tyrosine residues of SF. Besides, the TPSF showed severely attenuated absorption at around 3300 cm− 1 in the Fourier-transform infrared (FT-IR) spectrum, which could be attributed to the substitution of hydroxyl groups on SF (Fig. 1D). Also, new signals observed at approximately 1750 cm− 1 and 1600 –1450 cm− 1 were identified as carbonyl and phenyl groups, respectively. Compared with SF materials, modified SF products exhibited changes in the amide I, II, and III vibration modes at 1647, 1518, and 1235 cm− 1, respectively. The deconvolution of the peak fitting results indicated an increase in the proportion of random coil and α-helix structures within TPSF, facilitating the self-assembly into well-defined and morphologically uniform nanoparticles (Fig. S1C-F). Furthermore, the electron paramagnetic resonance (EPR) spectrum revealed that the characteristic triplet signal attributed to Tpl emerged in TSF and TPSF (Fig. 1E). These findings collectively indicate that Tpl and PBAP units were successfully modified on SF.
Design, preparation, and characterization of functionalized SF material (TPSF). (A) Schematics showing the preparation process of TPSF. (B) The synthetic route for the functionalization of SF to form TPSF. (C-E) 1H NMR (C), FT-IR (D) and EPR (E) spectra of different materials including SF, TSF and TPSF
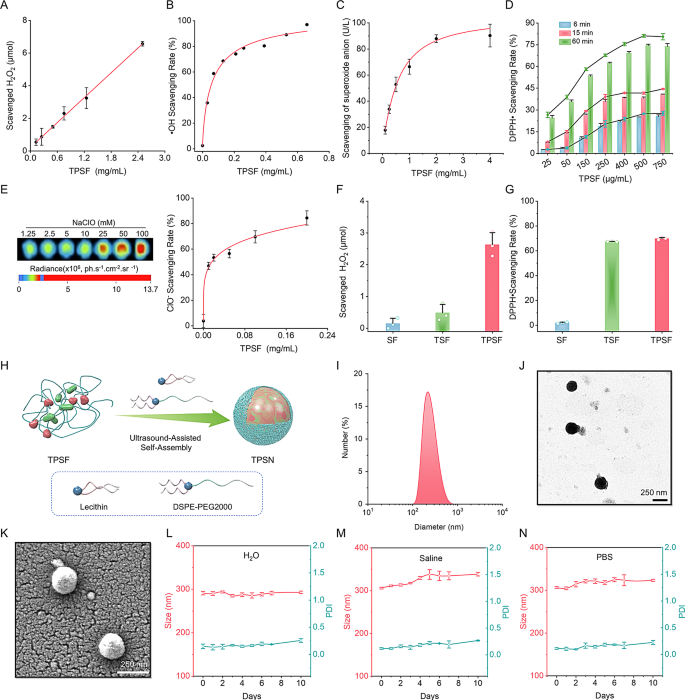
Next, we evaluated the ROS-scavenging capacity of TPSF in vitro. Initially, we investigated the H2O2 elimination capability by incubating TPSF with H2O2 solution for 24 h. Upon detecting the residual H2O2 concentration, a dose-dependent elimination pattern was observed (Fig. 2A). Additionally, the superoxide anion (O2•−) scavenging capacity was assessed. Our results indicated that TPSF was able to scavenge O2•− in a dose-response manner after reacting with the hybrid system for 40 min (Fig. 2C). Furthermore, to quantify the free radical and hypochlorite (ClO−) eliminating capabilities of TPSF, established methods derived from published literature were employed [65, 66]. Briefly, OH radical (•OH) was produced by the Fenton reaction, and methylene blue (MB) served as the •OH indicator probe. When •OH was generated, the color of mixture solution containing MB rapidly changed from dark blue to pale blue. Notably, the color of mixed system showed minimal changes after the addition of 1 mg/mL TPSF and the •OH scavenging rate correlated with the TPSF concentration (Fig. 2B; Fig. S2C). Moreover, 2,2-diphenyl-1-picrylhydrazyl (DPPH•), a nitrogen-free radical, was also eliminated by TPSF in a dose and time-associated pattern (Fig. 2D). The color of DPPH• solution shifted from modena to lavender upon the addition of TPSF (Fig. S2A, D). Additionally, a luminescent nanoprobe was employed to detect the capacity of TPSF to scavenge hypochlorite (ClO−). As expected, TPSF was capable of elimination ClO− (Fig. 2E; Fig. S2B). Compared with SF and TSF alone, TPSF can efficiently scavenge both H2O2 and free radical (Fig. 2F, G). Furthermore, the results of 1H NMR and HPLC analyses demonstrated that TPSF hydrolyzed to produce HMP (4-hydroxymethylphenol) in a 10 mmol/L H2O2 solution (Fig. S3). Collectively, all these results demonstrate that TPSF possesses a robust ROS-scavenging abilities.
Assessment of the ROS-scavenging capability of TPSF and characterization of TPSN. (A-C) Elimination of H2O2 (A), OH radical (B) and superoxide anion (C) by TPSF after incubation for 24 h, 90 min and 40 min, respectively. (D) Concentration-dependent and time-dependent scavenging of the DPPH radical by TPSF. (E) Hypochlorite-scavenging efficiency of TPSF at different doses after 15 min incubation. The left panel shows typical fluorescent images at different doses of sodium hypochlorite, while the right panel presents a quantitative analysis of the hypochlorite-scavenging efficiency of TPSF. (F-G) Comparative analysis of scavenging capabilities of different materials for H2O2 and DPPH radical. (H) Schematic diagram illustrating the preparation of TPSN. (I-K) Size distribution profiles (I), representative TEM (J) and SEM (K) image of TPSN. The mean size of TPSN was 291 ± 4 nm and the mean zeta potential was − 33 ± 2 mV. (L-N) The mean size distribution of TPSN in deionized water (L), saline (M), PBS (N) during 10 days
Preparation and characterization of TPSN
TPSN was fabricated using a modified self-assembly method, as illustrated in Fig. 2H. In brief, a small amount of DSPE-PEG and lecithin solution formed the aqueous phase, into which the TPSF solution was incrementally added. After ultrasound-assisted self-assembly, spherical-like TPSN was obtained, as presented in transmission electron microscopy (TEM) and scanning electron microscopy (SEM) images (Fig. 2J, K). The crystalline structure of TPSN was evaluated using XRD, which indicated a substantial presence of amorphous regions (Fig. S6C). This low crystallinity of TPSN may enhance the susceptibility to degradation in vivo. Dynamic light scattering (DLS) analysis revealed a narrow size distribution profile with a mean diameter of 291 ± 4 nm (Fig. 2I). Also, the zeta potential value was − 33 ± 2 mV. Notably, the average size of TPSN could be altered by adjusting the TPSF mass and the oil-to-water volume ratio. For example, when TPSF mass was 40 mg and 30 mg at an oil-to-water volume ratio of 1:10, the diameters of the negatively charged TPSN were 324 ± 0.3 nm and 325 ± 8 nm, respectively, with corresponding polydispersity index (PDI) values of 0.19 ± 0.01 and 0.16 ± 0.04 (Fig. S4A, B, E, F). While the volume ratio was changed to 3:20, the mean sizes were 291 ± 4 nm and 334 ± 5 nm, with respective PDI values of 0.15 ± 0.04 and 0.17 ± 0.03 (Fig. S4C, D, E, F). Overall, for the following experiments, TPSN was synthesized using 40 mg of TPSF at a volume ratio of 3:20.
Subsequently, the stability of TPSN was assessed by monitoring the size and zeta potential changes of TPSN in distilled water, saline, and PBS at predetermined time points (Fig. 2L-N, Fig. S6A). The size of TPSN exhibited minimal changes over a 10-day period in saline and PBS, while it performed hardly any changes in distilled water. Additionally, the zeta potential and PDI values remained negatively charged and below 0.3, respectively. Furthermore, TPSN exhibited stability under weakly acidic and basic conditions, and within a temperature range from 4 °C to 37 °C at pH = 7.4 (Fig. S6E, F).
Additionally, the ROS-scavenging capability and hydrolysis profiles of TPSN was also examined. Typically, the DPPH• elimination ability of TPSN was similar to that of the TPSF material and still correlated with the concentration of TPSN (Fig. S6B). Subsequently, it was found that the hydrolysis rate and degree of TPSN increased significantly when incubated with H2O2 at 1 × 10− 2 mol/L. In contrast, when incubated in PBS, a much lower rate of hydrolysis was observed (Fig. S6D), confirming that TPSN could be ROS responsive hydrolysis.
In vitro anti-oxidative stress and anti-inflammation activity of TPSN
The pivotal feature of inflammatory cells is intracellular ROS elevation [67]. Recovery of intracellular redox homeostasis is an important strategy for attenuating inflammation-associated diseases. Macrophages and neutrophils play critical roles in the pathogenesis of numerous inflammatory diseases. Therefore, we first examined the cellular uptake of TPSN in macrophages and neutrophils. To quantify and visualize the in vitro phagoptosis of TPSN, similar Cy5-TPSN was obtained by labeled Cy5 fluorescent dye (Fig. S5A). After incubating Cy5-TPSN with RAW264.7 macrophage cells, cellular internalization was detected by flow cytometry and confocal laser scanning microscopy (CLSM). It was shown that the internalization of Cy5-TPSN exhibited a time- and dose-dependent pattern in RAW264.7 and primary intraperitoneal neutrophil cells (Fig. S8, 9). Particularly, significant red fluorescence was observed in RAW264.7 cells after incubation with 25 µg/mL of Cy5-TPSN for 1 h. The intensity of red fluorescence signal increased with the incubation time and dose of Cy5-TPSN. Based on these findings, the fluorescence intensity of Cy5-TPSN was further quantified by flow cytometry. Likewise, a similar phenomenon of internalization in primary intraperitoneal neutrophil cells was discovered (Fig. S9). These findings collectively demonstrate that TPSN can be rapidly and effectively phagocytosed by macrophages and neutrophils.
Due to the significant role of ROS in inflammation-related diseases, we proceeded to assess the antioxidant stress capacity of TPSN in vitro. 2,7-Dichlorodihydrofluorescein diacetate (DCFH-DA) probe, a fluorescent indicator that signals the presence of ROS upon oxidation, was used to evaluate the cellular ROS levels. Compared to model group, RAW264.7 cells preincubated with TPSN exhibited significantly lower fluorescence intensity after PMA stimulation (Fig. S12A, B). It was demonstrated that TPSN can effectively reduce the intracellular ROS level in inflammatory cells. To further verify the anti-ROS capability of TPSN, NAC and nanoparticles prepared with different modifying materials were selected as concurrent control treatments. NAC was included due to its previously established antioxidant properties, which are attributed to its ability to elevate intracellular GSH levels [68]. The nanoparticles SN and TSN were fabricated based on SF and TSF respectively, and then characterized by DLS and TEM (Fig. S5B, C). The mean sizes of SN and TSN were 223 ± 2.6 nm and 289 ± 2.6 nm, respectively. Simultaneously, the zeta-potential values were evidently negative, measured at -19.2 mV and − 14.37 mV. As expected, TPSN exhibited a superior ability to inhibit the generation of intracellular ROS compared to both SN and TSN. Furthermore, the efficacy of TPSN was comparable to, or slightly exceeded, that of the NAC treatment. (Fig. S12C, D). Consistent with the findings based on flow cytometric analysis, fluorescent images showed weaker fluorescence in cells treated with TPSN (Fig. S12 F, upper row).
Subsequently, we investigated whether TPSN could protect macrophages from ROS-induced cell damage. As shown by CCK8 assay, exposing RAW264.7 cells to 2 × 10− 4 mol/L H2O2 and different concentrations of TPSN simultaneously resulted in a significant cellular protective effect (Fig. S12E). Notably, cells treated with high concentration of TPSN (50 µg/mL) revealed considerably higher viability compared to those treated with fresh medium alone. In addition, as demonstrated by flow cytometry analysis, incubation with 2 × 10− 4 mol/L H2O2 led to marked apoptosis, particularly when compared to cells treated with culture medium alone. By contrast, preincubation with TPSN (50 µg/mL) significantly mitigated H2O2-induced cell apoptosis (Fig. S12G, F, lower row). Meanwhile, cells in other groups, including those treated with TSN and NAC, also exhibited lower apoptosis rates but still retained a higher degree than those treated with TPSN. Collectively, TPSN revealed obvious cell protective effects by inhibiting cellular ROS generation and oxidative stress-mediated cell apoptosis. These findings correspond to the characterization results of TPSF, further demonstrating its ability to scavenge ROS.
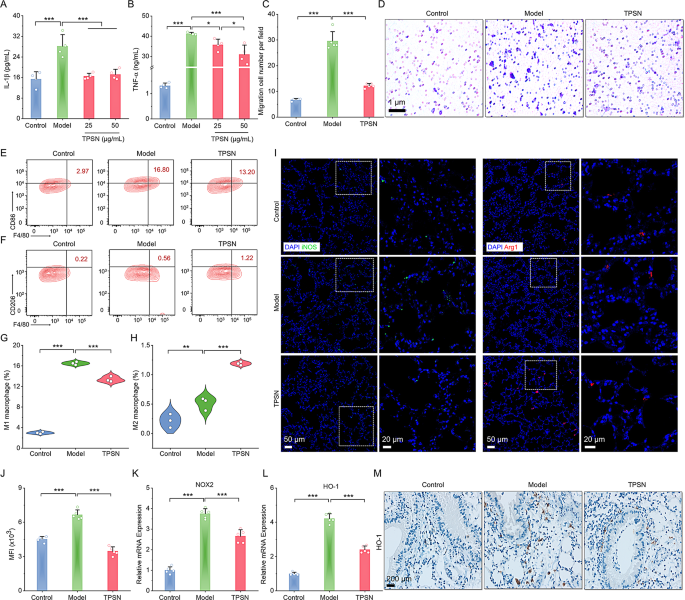
Based on the above results, we subsequently investigated the anti-inflammatory capacity of TPSN in vitro. As demonstrated in Fig. 3A-B, the secretion of inflammatory cytokines (IL-1β and TNF-α) increased dramatically in LPS-stimulated RAW264.7 cells. Conversely, treatment with TPSN resulted in a reduction of inflammatory factors. In a separate assay, we also found that the relative mRNA expression levels of IL-6, IFN-γ, and TGF-β were decreased in cells treated with TPSN (Fig. S11A-C). As well know, macrophage migration plays a critical role in various inflammatory diseases due to the accumulation of pro-inflammatory cytokines [69]. Therefore, we evaluated the anti-migratory effect of TPSN on cells. Results of transwell assay confirmed that TPSN can inhibit macrophage migration (Fig. 3C, D). However, cells in the model group, induced by neutrophils alone, showed a large number of migrated cells. At the same time, TPSN can inhibit the migration of neutrophils themselves (Fig. S11D, E). Taken together, it indicates that TPSN possesses significant anti-inflammatory and anti-oxidative stress abilities.
Assessment of anti-inflammatory and anti-oxidative stress capabilities and modulation of macrophage phenotype by TPSN treatment. (A-B) The expression levels of IL-1β (A) and TNF-α in the RAW264.7 cell culture medium following treatment with various doses of TPSN. (C) Quantitative analysis of migrated cells across five fields. (D) Typical optical microscopy images of primary neutrophils-induced migration in RAW264.7 cells, positively stained with crystal violet. (E, F) Representative flow cytometric profiles illustrating the proportion of M1 (F4/80+CD86+, E) and M2 (F4/80+CD206+, F) macrophages after TPSN treatment. RAW264.7 cells were stimulated with 100 ng/mL LPS and 5 ng/mL IFN-γ for 33 h, followed by treatment with 50 µg/mL TPSN for 8 h. (G, H) Quantitative analysis of M1 and M2 phenotype macrophage, respectively. (I) Immunofluorescence staining of iNOS and Arg1 in lung sections of ALI mice treated with TPSN. The right panel indicates zoomed-in images of the boxed fields regions corresponding to fluorescence signals. Blue, DAPI-nuclear staining; green, iNOS; red, Arg1. (J) The intracellular ROS level in lung tissues of ALI mice treated with TPSN. Single-cell suspensions of lung tissues were stained with DCFH-DA and analyzed by flow cytometry. (K, L) The mRNA expression levels of pro-oxidant genes (NOX2) and antioxidant genes (HO-1) in lung tissues. (M) Immunohistochemical staining of HO-1 in lung sections. Data are presented as mean ± SD (n = 3–5). *p < 0.05, **p < 0.01, ***p < 0.001
Promotion of macrophage phenotype transformation and regulation of redox homeostasis by TPSN
Given the significant role of macrophages in the progression of inflammation, we further investigated the potential of TPSN to modulate macrophage phenotypes. Initially, we employed LPS and IFN-γ as stimulating factors to induce the transformation of RAW264.7 macrophages into the M1 phenotype. After co-incubation with 50 µg/mL TPSN, cells were collected for staining and flow cytometry analysis. The results presented in Fig. 3E-H indicated that cells in the TPSN group exhibited a lower M1 phenotype (F4/80+CD86+) and a higher M2 phenotype (F4/80+CD206+) compared to the cells stimulated by LPS and IFN-Fγ alone. These results suggest that TPSN can regulate the transformation of pro-inflammatory M1-type macrophages into anti-inflammatory M2-type macrophages in vitro. Furthermore, we conducted verification of the results in mice with acute lung injury (ALI). The mice model was established according to a previously described method, briefly induced with LPS via intranasal delivery [65]. Upon comparison of ALI mice treated with TPSN, analysis of the fluorescence image demonstrated that ALI mice showed stronger iNOS protein (green fluorescence) and weaker Arg-1 protein signals (red fluorescence signal), which respectively represented the M1 and M2 type macrophages (Fig. 3I). Totally, TPSN can effectively induce the macrophage phenotype transformation from M1 to M2 forms both in vitro and in vivo. Additionally, after incubating a single-cell suspension of lung tissue with DCFH-DA probe, flow cytometry results showed a reduced ROS level in lung tissue cells from TPSN-treated ALI mice (Fig. 3J). Meanwhile, the RT-qPCR analyses demonstrated the downregulation of pro-oxidant genes (NOX2, NADPH oxidase 2) and antioxidant genes (HO-1, heme oxygenase-1) after TPSN treatment (Fig. 3K, L). This was also consistent with the immunohistochemistry results of HO-1 (Fig. 3M). These results illustrated that TPSN was able to inhibit oxidative stress and restore the balance between prooxidants and antioxidants in the lesions. Consequently, TPSN can not only facilitate the shift of macrophages toward an anti-inflammatory state but also contribute to the restoration of redox balance in injured sites.
Targeted therapy of ALI in mice with TPSN
Building upon the aforementioned promising results, in vivo studies were performed to investigate the therapeutic efficacy of TPSN in experimental animal models of inflammatory diseases. ALI represents a common life-threatening pulmonary condition characterized by oxidative stress and severe inflammation [70]. Prior to therapeutic evaluation, we examined the biodistribution of TPSN initially. After i.v. administration of Cy5-TPSN in normal BALB/c mice, we collected blood samples and major organs for fluorescence imaging. As shown in Fig. S13A, a correspondingly rapid clearance pattern from blood was observed. The fluorescence intensity decreased by half after approximately 1.5 h post-injection. By contrast, the fluorescent signals rapidly increased in the major organs, including lungs and kidneys (Fig. S14).
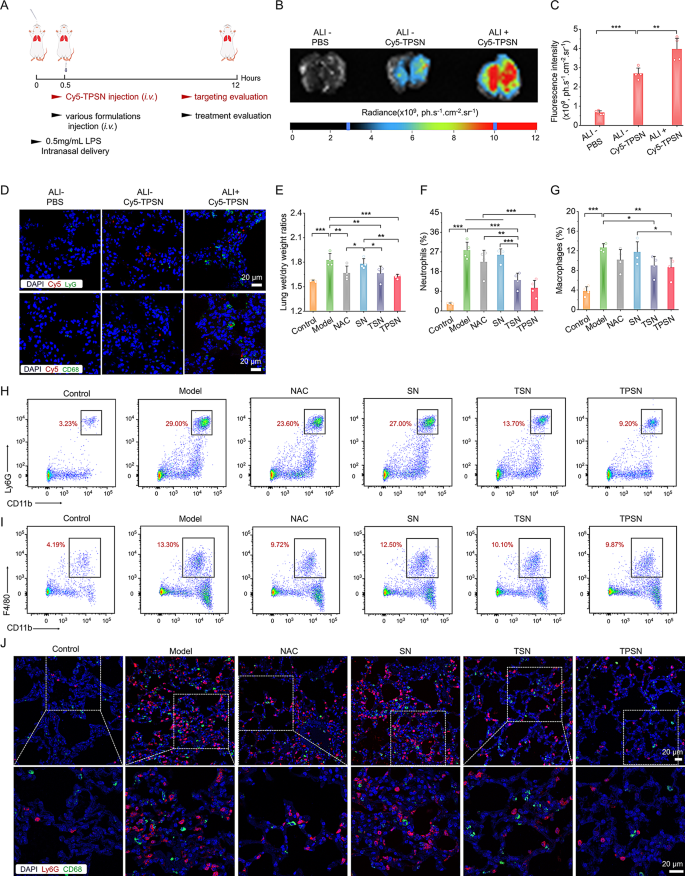
Subsequently, we investigated whether TPSN can be effectively accumulated at injured lung tissues. All mice were treated as illustrated in Fig. 4A. We compared the fluorescence intensity of Cy5 in the lungs of normal and ALI mice administrated with Cy5-TPSN. Results from ex vivo imaging exhibited the accumulation of Cy5-TPSN in normal lungs, accompanied by significantly higher fluorescence signals in injured lung tissues (Fig. 4B, C). It can be attributed to the increased permeability caused by the disruption of vascular endothelial and epithelial barriers in injured lungs. Furthermore, immunofluorescence staining was used to evaluate the cellular distribution of Cy5-TPSN. CD68 and Ly6G were used to mark the macrophages and neutrophils, respectively. In ALI mice treated with Cy5-TPSN, Cy5 fluorescence was observed in both neutrophils and macrophages (Fig. 4D). In contrast, no fluorescence signals were found in both cells of normal mice. Additionally, a comparatively higher level of Cy5 fluorescence was observed in lung cryosections of ALI mice. Moreover, TPSN was confirmed to be engulfed by neutrophils and macrophages in cell experiments. Together, these results indicated that phagocytosis of inflammatory cells can enhance the injured site targeting capacity of TPSN. Additionally, cellular uptake of Cy5-TPSN by pulmonary microvascular endothelial cells (PMVEC) occurred in a dose- and time-dependent manner (Fig. S10). Therefore, TPSN can effectively accumulated in damaged lungs, thereby providing a foundation for subsequent therapeutic studies.
In vivo targeting performance and therapeutic efficacy of TPSN in ALI mice after i.v. administration. (A) Schematic illustration of the establishment of ALI mice model and treatment regimens. (B, C) Typical ex vivo images (B) and quantitative analysis (C) indicating the accumulation of Cy5-TPSN in the lungs at 12 h after i.v. administration of Cy5-TPSN. (D) Confocal microscopy images of lung cryosections showing the co-localization analysis between Cy5-TPSN and CD68+ macrophages or Ly6G+ neutrophils. (E) The lung wet-to-dry weight ratios after different treatment. (F-I) Flow cytometric quantitative analysis and typical dot plots of neutrophil (F, H) and macrophage (G, I) proportions in pulmonary tissues of ALI mice. (J) Confocal microscopy images of CD68+ macrophages and Ly6G+ neutrophils in lung cryosections of ALI mice. The ALI mice model was established with 50 µL LPS at 0.5 mg/mL via intranasal delivery. After 0.5 h, mice received different formulations by i.v. injection. In the therapeutic efficacy assay, mice in the model group received saline, whereas the other groups were treated with NAC, SN, TSN, or TPSN at a dosage of 2 mg/kg, respectively. At 12 h after various treatments, mice lungs were collected for quantitative and histological analyses. Data are presented as mean ± SD (n = 4). *p < 0.05, **p < 0.01, ***p < 0.001
Encouraged by the efficient anti-inflammatory and targeting capability of TPSN, the therapeutic effect of TPSN was investigated in ALI mice. The levels of pro-inflammatory cytokines IL-1β, TNF-α, and MCP-1 in bronchoalveolar lavage fluid were obviously decreased after treatment with TPSN at a dosage of 2 mg/kg (Fig. S15). In contrast, administration of TPSN at 0.5 mg/kg did not yield a therapeutic outcome, except for a reduction in IL-1β levels.
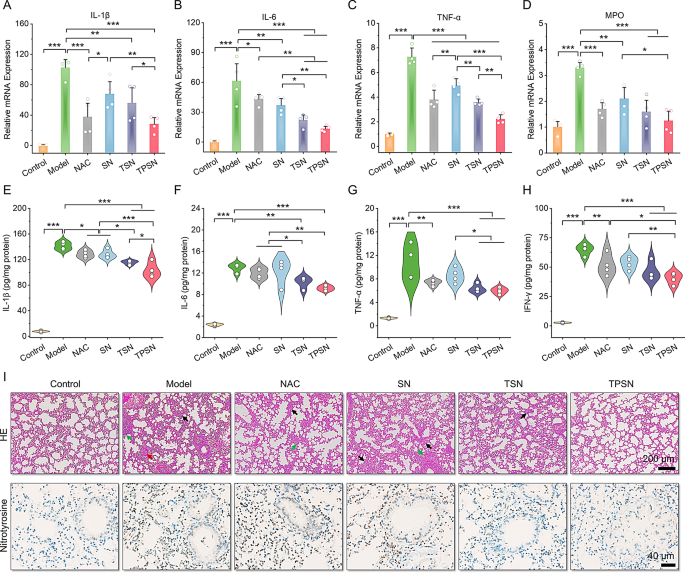
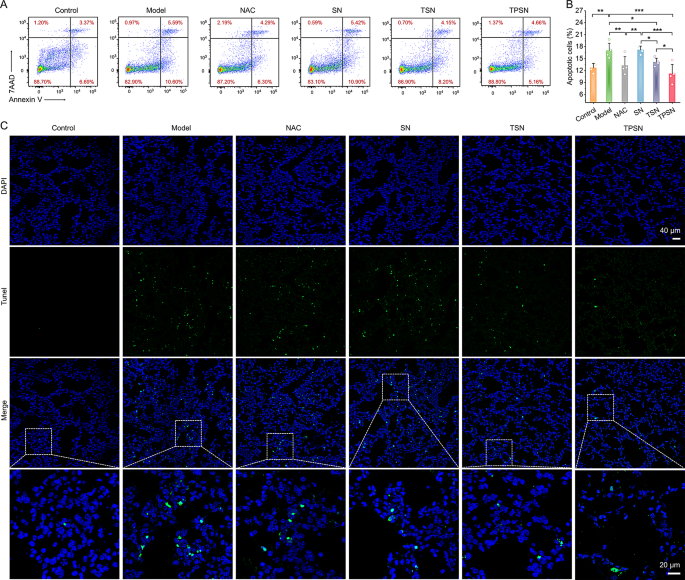
Furthermore, the therapeutic efficacy of TPSN was also compared in more detail with those of NAC, SN, and TSN. The lung wet/dry weight ratio, an index of pulmonary edema caused by acute inflammation, was remarkably decreased by therapy with 2 mg/kg TPSN and NAC, compared to ALI mice treated with saline (Fig. 4E). Similarly, TSN therapy could also improve the pulmonary edema of ALI mice, except for SN treatment. These results were consistent with the narrow-spectrum ROS-scavenging capacity of TSN. As mentioned above, ALI is mechanistically associated with pulmonary infiltration of immune cells, such as neutrophils and macrophages [70]. Excessive infiltration usually causes damage to lung tissues because of the large production of pro-inflammatory cytokines and chemokines [71]. Thus, the neutrophils and macrophages in lung tissues were measured by flow cytometry analysis and immunofluorescence staining. Compared to normal mice, a significant increase in neutrophils and macrophages was observed in ALI mice treated with saline (Fig. 4F-I). However, TPSN treatment effectively decreased the proportion of neutrophils and macrophages to 10.45 ± 3.86% and 8.64 ± 2.12%, respectively. Likewise, TSN, with limited ROS-scavenging capability, displayed relatively weaker inhibition of inflammatory cell infiltration. Of note, both of them were superior to NAC treatment. However, treatment with SN did not demonstrate any therapeutic effect. Consistent with the flow cytometric analysis results, the therapeutic effect of TPSN was also confirmed in immunofluorescence staining (Fig. 4J). Therapy with TPSN resulted in the weaker expression of CD68 (green fluorescence) and Ly6G (red fluorescence) in the sections of lung tissues. These results were in accordance with the decreased levels of inflammatory cytokine (Fig. 5A-H; Fig. S16). The gene expression of pro-inflammatory factors, including IL-1β, IL-6, TNF-α, and MPO, was significantly downregulated after TPSN therapy. Meanwhile, similar results were found through measuring the level of inflammatory factors in serum and lung tissue homogenates by ELISA. Further hematoxylin and eosin (H&E)-stained sections were used to evaluate the pathological changes in lung tissues. As illustrated in Fig. 5I (upper panel), the lung tissues of ALI mice exhibited notable pathological changes, including significant infiltration of neutrophils (indicated by green arrow), thickened alveolar walls, collapsed alveolar, and parenchymal lesions (indicated by black arrow), along with a large number of necrotic epithelial cells and infiltrated neutrophils filling the bronchial lumen (indicated by red arrow). Whereas only a few histological abnormalities were observed after TPSN treatment. Additionally, immunohistochemical staining of nitrotyrosine was performed to evaluate the anti-oxidative stress capability of TPSN (Fig. 5I, lower panel). Nitrotyrosine, considered a sensitive biomarker of oxidative stress, is formed by peroxynitrite-mediated nitration on protein tyrosine residues. Compared to NAC, SN, and TSN treatments, TPSN therapy resulted in a lower expression of nitrotyrosine, almost equal to that of normal mice. Moreover, therapeutic effects of TPSN were also confirmed by detecting apoptotic cells in lung tissues. Notably, flow analysis revealed that TPSN therapy mitigates cell apoptosis in the lung tissue of ALI mice (Fig. 6A, B). TdT mediated dUTP nick-end labeling (TUNEL) staining of the lung tissue sections exhibited similar results (Fig. 6C). Compared to normal mice or TPSN-treated ALI mice, much stronger TUNEL positive signals were found in ALI mice. Likewise, SN showed no anti-apoptotic effects, and TSN could partly protect cells from apoptosis. Collectively, TPSN demonstrated superior tissue protection capabilities compared to NAC and TSN therapy, as evidenced by lower lung wet/dry weight ratios, reduced pulmonary infiltration of inflammatory cells, decreased secretion of pro-inflammatory factors, inhibited formation of oxidation products, and mitigated cell apoptosis in lung tissues. Consequently, these results demonstrate that TPSN, with effectively lung targeting capacity and anti-inflammatory properties, holds promise as a potential therapeutic strategy for ALI.
Evaluation of the anti-inflammatory effect of TPSN and histological analysis in ALI mice. (A-D) Quantification of mRNA levels for IL-1β (A), IL-6 (B), TNF-α (C) and MPO (D) in lung tissues of ALI mice following different treatments. (E-H) Serum expression levels of IL-1β (E), IL-6 (F), TNF-α (G) and IFN-γ (H) in ALI mice as measured by ELISA. (I) H&E staining (upper panel) and nitrotyrosine immunohistochemically staining (lower panel) of lung tissue sections. Black arrows indicate alveolar wall thickening and substantial lung tissues. Green arrows indicate areas of neutrophils infiltration. Red arrows point to accumulative necrotic epithelial cells and extravasated neutrophils in the bronchial lumen. Data in (A-H) are mean ± SD (n = 4). *p < 0.05, **p < 0.01, ***p < 0.001
Analysis of anti-apoptotic capability of TPSN in lung tissues from ALI mice subjected to various formulations. (A-B) Flow cytometric profiles (A) and quantitative data (B) of apoptotic lung tissue cells after different treatments. (C) TUNEL-stained analysis of lung sections. Data are mean ± SD (n = 4). *p < 0.05, **p < 0.01, ***p < 0.001
Therapeutic efficiency of TPSN in Cisplatin-Induced AKI mice
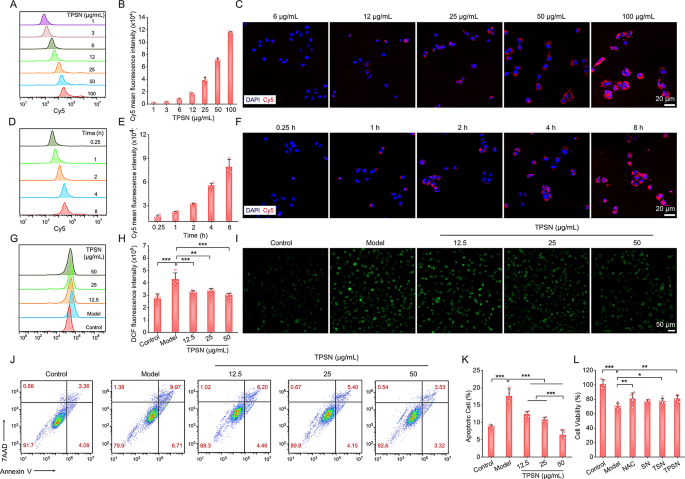
To validate the universality of the aforementioned silk fibroin-based nanomedicine, we examined the therapeutic efficacy of TPSN in a murine model of cisplatin-induced acute kidney injury (AKI). It is well-documented that oxidative stress and inflammation are critical factors in the pathogenesis of cisplatin nephrotoxicity [72]. This nephrotoxicity represents a significant adverse effect on normal organs in patients undergoing cisplatin-based chemotherapy, substantially impacting their clinical outcomes [72]. Therefore, the cytoprotective effect of TPSN was evaluated in cisplatin-induced cell damage. Considering that the renal epithelial cells are susceptible to oxidative stress in AKI, we used HK-2 cells to study cytoprotective properties of TPSN against ROS damage. As shown in Fig. 7A-F, HK-2 cells can endocytose TPSN in a dose- and time-dependent manner, as evidenced by flow cytometry and confocal microscopy analysis. Next, we examined the inhibitory effect of TPSN on intracellular ROS production (Fig. 7G-I). After treatment with 10 µmol/L cisplatin, HK-2 cells showed a dramatically increased in intracellular ROS. In comparison, when cells were co-incubated with TPSN, the intracellular ROS significantly decreased. Qualitative analysis of intracellular ROS was confirmed by fluorescence imaging. Consistent with our expectations, the ROS signals (green fluorescent) were markedly diminished following TPSN treatment. Moreover, flow cytometry analysis was employed to assess the inhibition capability of TPSN against cisplatin-induced cell apoptosis and necrosis (Fig. 7J, K). It clearly demonstrated that cisplatin can promote HK-2 cells apoptosis and necrosis. By contrast, the apoptotic ratio of HK-2 cells was significantly decreased after treatment with TPSN. Notably, the high-dose TPSN (50 µg/mL) showed a better cytoprotective effect than other doses. Meanwhile, we additionally compared cytoprotective effect of TPSN with NAC, SN, and TSN in CCK8 assay. As illustrated in Fig. 7L, cisplatin markedly reduced the cell viability of HK-2 cells, and this decline was noticeably alleviated by TPSN. For other treatments, NAC and TSN exhibited a cytoprotective effect, consistent with their inhibition of H2O2-induced apoptosis in RAW264.7 cells. Taken together, these results demonstrate that TPSN can protect cells against cisplatin-induced cell damage by reducing intracellular ROS levels, inhibiting apoptosis, and preventing necrosis.
Evaluation of cytoprotective effects of TPSN in cisplatin-induced HK-2 cells damage. (A, B) Flow cytometric profiles (A) and quantification counts (B) indicating dose-dependent cellular uptake of Cy5-TPSN in HK-2 cells after 2 h incubation. (C) Fluorescence images showing dose-dependent internalization of Cy5-TPSN in HK-2 cells. (D, E) Typical flow cytometric curves (D) and quantitative analysis (E) of time-dependent cellular uptake of Cy5-TPSN at 25 µg/mL. (F) Confocal microscopy images indicating time-dependent internalization of Cy5-TPSN at 25 µg/mL in HK-2 cells. (G, H) Flow cytometry profiles (G) and quantitative data (H) of intracellular ROS generation in HK-2 cells after treatment with different dose of TPSN. (I) Fluorescence images showing a representative reduction in intracellular ROS generation after TPSN treatment. The HK-2 cells were stimulated by 10 µmol/L cisplatin, followed by co-incubation with TPSN for 24 h. (J, K) Typical flow cytometric dot plots (J) and quantitative analysis (K) of apoptotic HK-2 cells after TPSN treatment. The HK-2 cells were induced with 15 µmol/L cisplatin, and then co-incubated with TPSN for 24 h. (L) Cell viability of HK-2 cells exposed to 15 µmol/L cisplatin and different formulations for 24 h. Data are mean ± SD (n = 3–4). *p < 0.05, **p < 0.01, ***p < 0.001
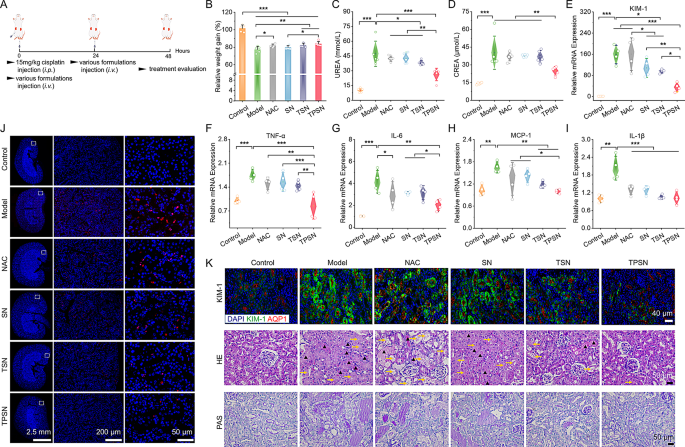
According to a reported established method, AKI was induced in mice by intraperitoneal injection of a single high dose of cisplatin (15 mg/kg, Fig. 8A). Based on the results of pharmacokinetics and biodistribution of TPSN, we observed a stronger accumulation of Cy5-TPSN in injured kidneys compared to healthy kidneys (Fig. S13B, C). These results were confirmed by immunofluorescence analysis (Fig. S13D). All of these findings suggested that TPSN can be efficiently targeted to injured kidneys. Next, we assessed the therapeutic effect of TPSN in AKI mice. After treatment with TPSN at 2 mg/kg, the levels of serum urea (UREA), serum creatinine (CREA), and IL-1β were significantly decreased (Fig. S17). Well-documented clinical indicators of renal dysfunction include high levels of UREA and CREA [73]. By contrast, TPSN at a dose of 0.5 mg/kg only showed a reduction in CREA and IL-1β expression.
Therapeutic effects of i.v. delivered TPSN in AKI mice. (A) Schematic illustration of the establishment and treatment regimens for cisplatin-induced AKI in mice. (B) Relative changes in body weight of AKI mice after different treatments. (C, D) Serum expression levels of UREA (C) and CREA (D) in AKI mice after various treatments. (E-I) Relative mRNA expression levels of KIM-1 (E), TNF-α (F), IL-6(G), MCP-1 (H) and IL-1β (I) in kidneys of AKI mice treated with distinct formulations. (J) TUNEL staining of the kidney cryosections from AKI mice. (K)Staining images of kidney sections marked with KIM-1 antibody (upper panel), H&E (middle panel) and PAS (lower panel). Aquaporin-1 (AQP1) is a biomarker of proximal tubule cells. The yellow arrows represented tubules with necrosis, epithelial anoikis cavitation or loss of brush border. Triangles indicated casts formation in tubes. Mice in model group were received with saline, while other groups were respectively treated with NAC, SN, TSN or TPSN at 2 mg/kg. Data are mean ± SD (n = 4–5). *p < 0.05, **p < 0.01, ***p < 0.001
Furthermore, in a separate experiment, we compared the therapeutic effects of TPSN with NAC, SN, and TSN at a dose of 2 mg/kg. As expected, AKI mice treated with TPSN or TSN showed relief from weight loss, whereas AKI mice (saline treated) exhibited dramatic bodyweight loss within 48 h (Fig. 8B). As indicated in Fig. 8C-D, treatment by TPSN significantly decreased the levels of UREA and CREA in AKI mice, demonstrating that TPSN could effectively restore renal function. By comparison, TSN only partially reduced the serum UREA level, indicating its limited capacity for ROS-scavenging. Similarly, NAC and SN did not show any therapeutic effect. Furthermore, the gene expression of pro-inflammatory factors, including TNF-α, IL-6, MCP-1, and IL-1β, was markedly inhibited by TPSN (Fig. 8F-I). This result was verified by immunohistochemistry staining for IL-6 (Fig. S19). Moreover, flow cytometry was used to analyze the infiltration of neutrophils and macrophages. Consistent with the RT-qPCR results, TPSN demonstrated the capability to inhibit neutrophil and macrophage infiltration (Fig. S18A-C). Kidney injury molecule-1 (KIM-1) is a novel biomarker that is closely associated with the renal tissue damage [74]. Indeed, the gene expression of KIM-1 in AKI mice was dramatically elevated compared to that in mice treated by TPSN (Fig. 8E). Meanwhile, immunofluorescence analysis showed similar expression patterns of KIM in AKI mice after TPSN therapy (Fig. 8K). Besides, histological analyses were conducted using H&E and PAS staining (Fig. 8K). Kidneys of AKI mice represented abnormal architecture with remarkable necrosis, epithelial anoikis cavitation, or loss of brush border in tubules (shown as yellow arrow). And the formation of cast structures in tubules (indicated by black triangles) was also noted, a feature that is regarded as a significant pathological indicator of renal injury. Similarly, PAS staining also revealed a large amount of glycogen deposition in the kidney tubules of AKI mice. Of note, all these histological abnormalities were effectively reversed by TPSN treatment.
The role of oxidative stress in cisplatin-induced nephrotoxicity is well established. Excessive accumulation of ROS within the proximal tubules triggers tubular cell apoptosis [72]. As illustrated by the TUNEL assay, apoptotic cells in TPSN group were obviously decreased compared to AKI mice treated with saline (Fig. 8J; Fig.S18E). Meanwhile, the H2O2 level in the homogenate of renal tissue was also measured. As expected, the H2O2 level in AKI mice was significantly reduced after TPSN treatment (Fig. S18D). Overall, AKI mice treated with other formulations only showed a significant decrease in some of the parameters assessed. Similar to the findings in ALI models, treatment of cisplatin-challenged mice with TPSN achieved desirable protective effects, as evidenced by notable reductions in the levels of UREA, CREA, KIM-1, H2O2, pro-inflammatory cytokines, and kidney tissue injury. Taken together, these results demonstrate that TPSN could effectively restore renal function in AKI mice.
Biocompatibility of TPSN
In light of its desirable anti-oxidative stress and anti-inflammatory activities in vitro and vivo, both animal experiments and in vitro assays were performed to assess the safety of TPSN. Firstly, the cytotoxicity of TPSN was evaluated in RAW264.7 and HK-2 cells. After incubation for 6 h and 12 h in RAW264.7 cells, relatively high cell viability was observed regardless of different doses of TPSN (Fig. S7A, B). Even at a dose of 250 µg/mL, 5-fold relative to the cellular administrated dose, the proportion of viable cells remained higher than 90% after incubation with TPSN for 12 h. Similarly, HK-2 cells incubatied with TPSN for 8 h showed negligible cytotoxicity (Fig. S7C). Furthermore, the hemolysis assay in vitro showed no hemolysis even at dose as high as 2 mg/mL of TPSN (Fig. S7D).
Moreover, acute toxicity tests were conducted in healthy mice following i.v. injection of TPSN at 100 and 200 mg/kg, respectively. Mice in all groups maintained their typical daily diet and water intake without experiencing weight loss or any general behavioral disorders (Fig. S20A). On day 14 after administration, the mice were euthanized. The blood routine test analysis revealed no significant alternations in typical hematological parameters, such as platelet (PLT), red blood cell (RBC), and hemoglobin (HGB) levels (Fig. S20B-D). Moreover, the biochemical parameters relevant to liver and kidney functions also showed no distinct variations between groups (Fig. S20E-H). Meanwhile, examination of H&E-stained sections of the brain, heart, liver, spleen, lungs, and kidneys revealed negligible injuries and pathological patterns (Fig. S21). In addition, monitoring the biochemical parameters related to liver and kidney function on days 1, 3, 5, and 7 post-administration revealed no significant differences between the groups (Table S2). Furthermore, TPSN can degrade into small molecule HMP in the homogenates of lung, kidney, and liver tissues (Fig. S22). Overall, these preliminary data indicate that TPSN has a good safety profile after i.v. administration, with no observed cytotoxicity or in vivo systemic toxicity, even at doses 50–100 times higher than the therapeutic dose. This additional evidence substantiates the safety and efficacy of our proposed strategy for constructing bioactive nanoparticles utilizing silk fibroin.


