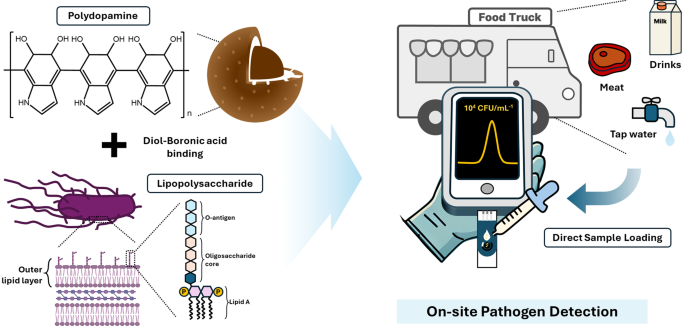
Figure 1 shows a schematic of the highly sensitive and selective sensor for S. typhimurium, which was developed by imprinting LPS onto a PDA surface. Polydopamine is an excellent template for MIP synthesis because of its versatile functional groups (catechol and amine), which enable strong interactions, tunable thickness depending on pH, and strong adhesion to various surfaces [22]. In particular, the thickness of the PDA coatings can be easily tuned based on the pH conditions during deposition [23]. This allows for precise control of the template layer thickness and optimization of the cavity structure in the resulting MIP. Nanospherical MIPs with large surface areas have been used to increase the number of binding sites [24]. Sodium cyanoborohydride was used to stabilize the binding of FPBA to the PDA core, thereby enabling the formation of boronic acid on the surface for cis-diol interaction with LPS [19, 25]. Salmonella is controlled in food trucks and restaurants to ensure food safety through hygiene training, safe ingredient sourcing, proper cooking and storage temperatures, prevention of cross-contamination, regular hand washing, thorough sanitation, and routine inspection [26]. Furthermore, onsite sensor technology for rapid and easy Salmonella detection is essential for enhancing food safety and preventing contamination.
Characterization of MIP
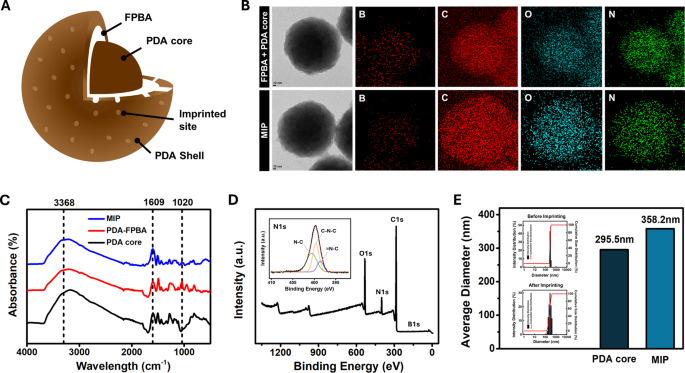
Figure 2A shows the structure of the LPS-imprinted MIP. An LPS-recognizing MIP was produced by introducing 4-formylphenylboronic acid (FPBA) onto the surface of the PDA nanoparticles to bind with the cis-diol structure of LPS. A nanoscale PDA shell was subsequently formed over the core particle and LPS was eluted to create binding sites on the MIP. Figure 2B shows transmission electron microscopy (TEM) images and energy-dispersive X-ray spectroscopy (EDS) mapping of the PDA core + FPBA and final MIP (PDA core + FPBA + PDA shell). After adding FPBA to the PDA core, the atomic compositions of B, C, N, and O were 10.3, 76.9, 4.1, and 8.8%, respectively. Following the formation of the PDA shell, the surface atomic compositions changed to 8.6%, 79.6%, 4.96%, and 6.79%, respectively. These changes indicate that the increased boron atom composition confirmed the successful formation of boronic acid on the PDA core surface, whereas the enrichment of C, N, and O validated the subsequent formation of the PDA shell [22, 27]. In addition, the changes in the functional groups throughout the fabrication process, from the PDA core to PDA-FPBA to the final MIP, were confirmed using FT-IR (Fig. 2C). Characteristic absorption bands of PDA in the PDA core and MIP were identified, including 3368 cm⁻¹ for N-H stretching and 1609 cm⁻¹ for C = C stretching [28]. For PDA-FPBA, a peak corresponding to B-O-B stretching appeared at 1020 cm⁻¹, whereas the intensity of the N-H and C = C stretching bands decreased, confirming the binding of FPBA to the PDA core [19]. XPS analysis was performed to examine the essential elements present on the surface. The presence of C, O, N, and B in the PDA core, PDA-FPBA, and MIP was confirmed. The deconvoluted C 1s, O 1s, and N 1s spectra are shown in Figs. 2E and S2. In the PDA-FPBA sample, the decrease in surface PDA compared to the core sample was accompanied by a reduction in the C = O, O = C, C = C, and C = N peaks. Consistent with the FT-IR results, the modification of the PDA core with FPBA resulted in the appearance of a B 1s peak. In the MIP sample, the C = O, O = C, C = C, and C = N peaks were partially recovered, most likely owing to the presence of the polydopamine shell [29, 30]. Therefore, the results of the FTIR and XPS analyses supported the uniform incorporation of boronic acid and dopamine into the MIP.
For the imprinting time optimization, the thickness of shell prepared with 2-hour and 1-hour, 45 min, and 30 min imprinting times were measured with DLS (Figure S3). It was determined that the MIP with 45 min imprinting time allows efficient LPS imprinting without hindering subsequent LPS rebinding, exhibiting the best rebinding performance. As shown in Fig. 2D, the average MIP particle size increased by approximately 50 nm from the PDA core size of 295.5 nm to 358.2 nm, suggesting that an imprinting time of one hour was optimal through the optimization process.
MIP fabrication and characterization: (A) internal structure of MIP nanoparticle, (B) TEM images and EDS mapping of FPBA + MIP core and MIP, (C) FT-IR spectra of MIP, PDA-FPBA, and PDA core, (D) XPS and high-resolution XPS spectra of N 1s region of MIP, and (E) DLS result and histogram of PDA core and MIP
LPS detection performance of MIP sensor
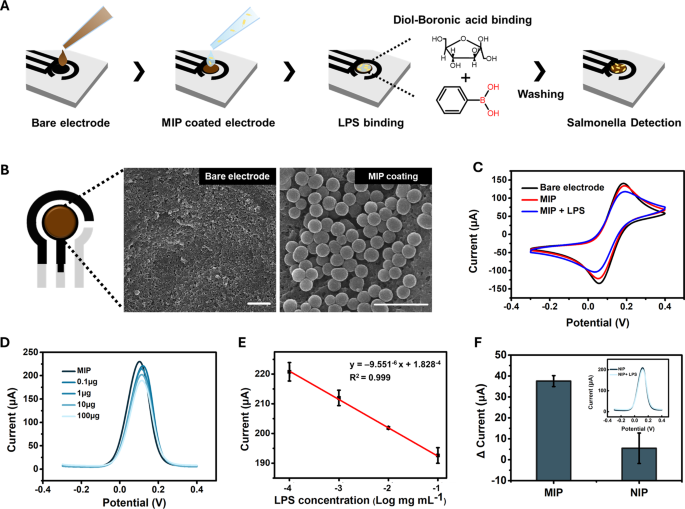
The sensing platform was fabricated using a working electrode made of single-walled carbon nanotubes (CNTs) and a counter electrode made of carbon both of which exhibit high electrical conductivity in various electrolytes [31, 32]. Ag/AgCl was used as the reference electrode. The working electrode was further modified with the final MIP using drop-casting to evaluate its capture performance (Fig. 3A). The SEM image in Fig. 3B shows that the nanosphere-shaped MIP was uniformly attached to the CNT electrode.
To evaluate the sensing functionality of Salmonella, the MIP-coated electrode was incubated with the LPS of S. typhimurium in PBS for 20 min, followed by washing with PBS to remove the unbound LPS, as shown in Fig. 3A. The incubation time was optimized by measuring DPV at 10-minute intervals, and pH 7.4 PBS was used to prevent structural changes in LPS (Figure S1). The binding of Salmonella LPS to SL-MIP was confirmed through cyclic voltammetry by comparing the bare electrode (CTL), MIP-coated electrode (SL-MIP), and LPS-incubated MIP electrode (LPS + SL-MIP). As shown in Fig. 3C, the oxidation and reduction peaks were observed at 0.185 and 0.057 V, respectively. Following MIP modification, a slight decrease in peak current and an increase in ΔEpa were observed, indicating a minor increase in resistance caused by the PDA layer. Notably, the addition of S. typhimurium LPS (1 mg/mL) to the SL-MIP electrode considerably reduced the oxidation and reduction current peaks, indicating increased resistance owing to LPS binding to SL-MIP.
Furthermore, we conducted differential pulse voltammetry (DPV), which has higher sensitivity and discrimination of analytes than similar oxidation potentials [33]. As shown in Fig. 3D, the DPV peak current at potentials of 0.11–0.12 V decreases with increasing LPS concentration, indicating the binding of LPS to the SL-MIP electrode. This concentration-dependent response exhibited a remarkable linear relationship between the logarithmic concentration of LPS (0.1–100 µg) and the DPV peak current, with an R² value exceeding 0.999 (Fig. 3E). The linear regression results for Fig. 3E showed a p-value of 1.39\(\:\times\:\)10−7, indicating a highly significant correlation. When comparing the responses of NIP and MIP to 100 µg of LPS, MIP exhibited a current change of 37.6 µA, whereas NIP exhibited a significantly lower and inconsistent response of 5.5 µA (Fig. 3F). The p-value for the difference between MIP and NIP was 0.043, confirming a statistically significant difference (p < 0.05). These findings demonstrated that the imprinting cavities on the LPS-mediated MIP surface were highly specific for Salmonella LPS. To further evaluate the reproducibility and repeatability of the prepared MIP sensor, identical electrodes were fabricated with MIPs produced on different days and used to detect LPS at a 1.0 mg/mL concentration (Figure S4). The peak current values remained consistent across the different electrodes, yielding a relative standard deviation (RSD) of 1.36%, demonstrating high reproducibility. Meanwhile, the DPV measured from MIPs produced on the same day exhibited minimal variation, a RSD of 1.98%, confirming repeatability.
LPS-detection performance of the SL-MIP: (A) experimental procedure for LPS and pathogen detection, (B) SEM image of bare electrode and SL-MIP, scale bar\(\:=1\:\mu\:m\), (C) CV curves of bare electrode, MIP, and LPS-bound MIP at 50mVs−1, (D) DPV curves for the different concentrations of LPS from 0.1 to 100 \(\:\mu\:\)g, (E) linear calibration curve of the SL-MIP for different LPS concentrations, and (F) current changes of MIP and NIP for 100 \(\:\mu\:\)g LPS
Salmonella detection performance of MIP sensor
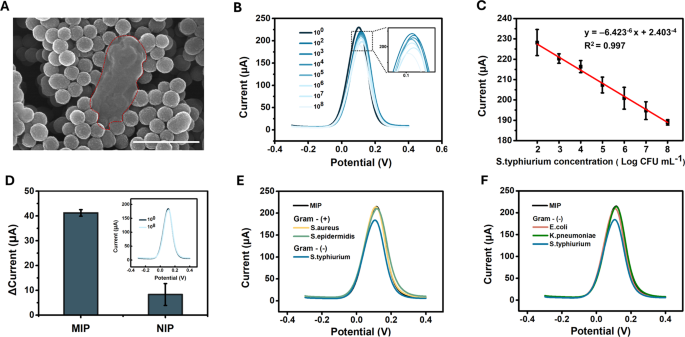
Figures 4A and S5 show an SEM image of MIP incubated with S. typhimurium for 30 min, followed by washing with PBS. Compared to LPS, the surface of the whole cell exhibits a more complex structure, which may explain the need for a longer incubation time to ensure sufficient binding strength (Figure S1). The areas marked with red dashed lines indicate the locations of the bacterial cells or their remnants surrounded by MIP. When comparing the quantitative detection capability for whole S. typhimurium bacteria, increasing cell concentration resulted in a gradual decrease in peak current at a potential of 0.11–0.12 V, similar to the response of MIP to LPS (Fig. 4B). The coefficient of determination (R2) was 0.997, indicating a strong linear correlation between the logarithmic concentration of S. typhimurium and the peak current within the 102–108 CFU/mL range, with a detection limit of 10 CFU/mL (Figs. 4C and S6). The linear regression results for Fig. 4C showed a p-value of 4.42 \(\:\times\:\) 10−4, confirming a statistically significant correlation. For the NIP, no significant difference was observed between the current responses to PBS and S. typhimurium at 10⁸ CFU/mL (Fig. 4D). The p-value for the difference between MIP and NIP was 0.0077, indicating a highly significant difference (p < 0.01). To evaluate the selectivity, the response of the MIP sensor was tested against various bacterial strains commonly found in food samples. First, we compared S. typhimurium (a gram-negative bacterium) with S. aureus and S. epidermidis (gram-positive bacteria), which lack LPS on their cell surfaces. As shown in Fig. 4E, the MIP template generated by the S. typhimurium LPS exhibited no response to S. aureus or S. epidermidis (10⁸ CFU/mL). We investigated whether the MIP sensor could discriminate between gram-negative bacteria, considering the presence of the LPS on the cell surface. Notably, the MIP sensor responded only to S. typhimurium and not to other gram-negative bacteria, such as E. coli and K. pneumonia (Fig. 4F). This selectivity can be attributed to the species-specific variations in the O-polysaccharide chain, as well as structural differences in the core and lipid A regions, which influence binding interactions with the imprinted cavities. Therefore, these findings suggest that the imprinted sites of MIP are highly specific to S. typhimurium, highlighting the ability of the sensor to differentiate between LPS from various bacterial species. Furthermore, the reproducibility and repeatability of the sensor were also evaluated for S. typhimurium at 107 CFU/mL (Figure S7). The peak current measured using MIPs produced on the same day demonstrated a repeatability RSD of 3.31%. When MIPs produced on different days were tested, the reproducibility RSD was 2.14%, indicating high consistency across different production batches. Additionally, Cohen’s kappa analysis was performed to compare the developed sensor with the traditional culture method [34]. The Cohen’s kappa index at 10² CFU/mL was 0.57, indicating moderate agreement, which improved to substantial (103 CFU/mL) or almost perfect (104 CFU/mL) agreement at higher inoculum concentrations, demonstrating the sensor’s high correlation with conventional detection methods.
Detection performance of the SL-MIP for S. typhimurium: (A) SEM image of S. typhimurium cell traces surrounded by MIP nanoparticles, (B) DPV curves for different concentrations of S. typhimurium (from 100 to 108 CFU/mL), (C) linear calibration curve of the SL-MIP for different concentrations of S. typhimurium, (D) current changes of MIP and NIP for 108 CFU mL− 1S. typhimurium, (E) DPV curves for gram-positive bacteria (S. aureus and S. epidermidis) and S. typhimurium at 108 CFU mL− 1, (F) DPV curves for gram-negative bacteria (E. coli and K. pneumoniae) and S. typhimurium at 108 CFU mL− 1
Salmonella detection performance of MIP sensor in food matrices
Salmonella is controlled in food trucks and restaurants to ensure food safety through hygiene training, safe ingredient sourcing, proper cooking and storage temperatures, prevention of cross-contamination, regular hand washing, thorough sanitation, and routine inspection [1]. Therefore, we investigated whether our MIP sensor could rapidly detect S. typhimurium in real food samples for the on-site detection of foodborne pathogens. Figure S8 shows the DPV response to various concentrations of S. typhimurium in food samples, including tap water, milk, and pork, whereas Fig. 5B illustrates the peak current of the DPV corresponding to these concentrations [35, 36]. The concentrations were selected based on levels known to cause diseases in humans. Notably, the MIP sensor exhibited a concentration-dependent response to the samples, even without pre-treatment. A baseline shift was observed owing to interfering with molecules in each sample, which could alter the conductivity of the sensor. Nevertheless, the degree of the decrease in the response current remained consistent across S. typhimurium concentrations. Linear regression curves with identical slopes were obtained for all the food samples, with corresponding R² values of 0.80, 0.90, and 0.87. To highlight the performance of the prepared MIP sensor, a comparison of the results with recently reported S. typhimurium sensors within the last three years is provided in Table 1.


