Synthesis and characterization of magMZIF-8
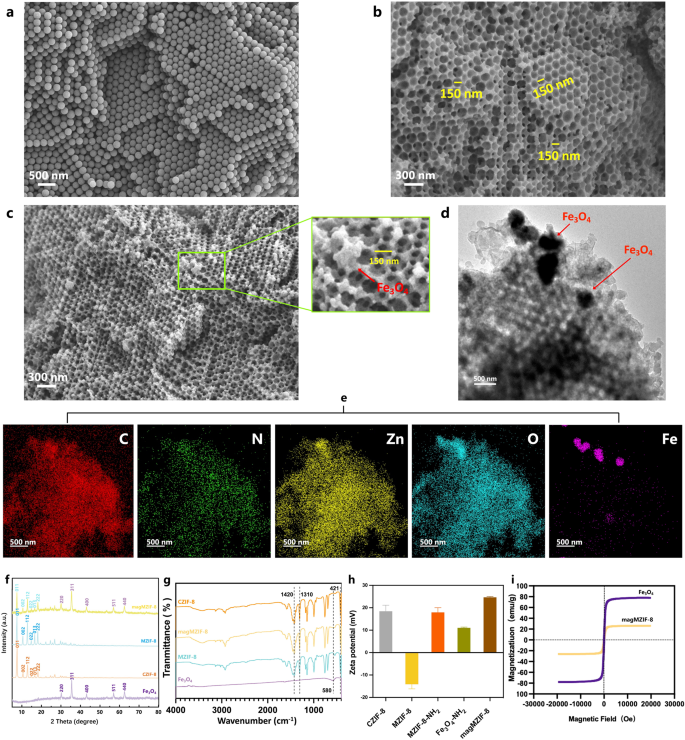
The synthesis of magMZIF-8 was shown in Scheme 1a. Firstly, the uniformly packed polystyrene (PS) template was prepared, followed by the addition of precursor liquid to obtain ZIF-8 precursor@PS. Then the nucleation crystallization of ZIF-8 was induced in a bis-solvent system, and the PS template was completely removed by DMF to obtain 3D ordered macroporous MZIF-8. In order to attach the amino group on the surface of MZIF-8 magnetic sphere Fe3O4-NH2, the amino group was modified by APTES on the surface of MZIF-8 to obtain MZIF-8-NH2, and then the amino crosslinking agent glutaraldehyde was added to crosslink MZIF-8-NH2 and Fe3O4-NH2 to obtain magMZIF-8. The morphology and structure of magMZIF-8 were observed by scanning electronic microscope (SEM) and transmission electronic microscope (TEM). As shown in Figs. 1a and 3D ordered PS template was obtained after centrifugation of polystyrene microspheres with a diameter of 200 nm, which was tightly packed and evenly arranged, laying a good foundation for the subsequent ordered growth of MZIF-8. Figure 1b demonstrated complete removal of the PS template, leaving only MZIF-8 that inherited the highly ordered structure of the PS template, with a pore size of about 150 nm. Figure 1c indicated successful modification of the MZIF-8 surface with a small number of Fe3O4 magnetic spheres, while retaining the intact macroporous structure, thus not affecting the exclusion efficacy towards urine impurities. Additionally, TEM analysis (Fig. 1d) revealed the internal composition of magMZIF-8, showcasing tightly ordered macroporous structures with interspersed black Fe3O4 magnetic spheres. Energy-dispersive X-ray (EDX) mapping (Fig. 1e) confirmed that the magMZIF-8 matrix comprises C, N, O, and Zn elements, with Fe particles selectively dispersed on its surface. The crystal structure of magMZIF-8 was elucidated through X-ray diffraction (XRD) analysis, as depicted in Fig. 1f, Fe3O4 and conventional ZIF-8 (CZIF-8) exhibited their typical crystal diffraction peaks respectively. The XRD patterns of MZIF-8 and CZIF-8 were identical, indicating that MZIF-8 retained the crystal structure of CZIF-8. The XRD pattern of magMZIF-8 represented a composite of the diffraction peaks from both MZIF-8 and Fe3O4, demonstrating that magMZIF-8 comprises these two components and preserved their crystal structures. Then the fourier transform infrared spectra (FT-IR) of different materials were measured. As shown in Fig. 1g, peaks at 421 cm− 1, 1310 cm− 1, and 1420 cm− 1, attributed to the tensile vibrations of Zn-N bonds and imidazole rings [13, 14], confirmed the presence of metal organic frameworks in CZIF-8, MZIF-8, and magMZIF-8. The peak at 580 cm− 1, arising from Fe-O [14, 15], was only observed in Fe3O4 and magMZIF-8. Given that only a small amount of Fe3O4 was modified in magMZIF-8, the peak intensity at 580 cm− 1 was relatively weak in magMZIF-8. The surface potential of materials was investigated through Zeta potential measurements, as shown in Fig. 1h. CZIF-8 exhibited a positive surface charge (18.43 mV), whereas MZIF-8 displayed a negative surface charge (-14.13 mV). This change in charge was consistent with previously reported variations in CZIF-67 and MZIF-67 [16]. After the modification of amino groups, MZIF-8-NH2 and Fe3O4-NH2 exhibited positive charges of 17.93 mV and 11.06 mV, respectively. The composite material magMZIF-8, resulting from the combination of these two components, also exhibited a positive surface charge (24.66 mV). Subsequently, the magnetization properties of the materials were evaluated through hysteresis curves. Fe3O4 and magMZIF-8 exhibited saturation magnetization values of approximately 78.03 emu/g and 26.21 emu/g (Fig. 1i), indicating that the surface of magMZIF-8 was sparsely decorated with Fe3O4, which was consistent with the results of TEM. In addition, it demonstrated that magMZIF-8 exhibited excellent magnetic responsiveness, enabling efficient and rapid solid-liquid separation of urinary exosomes. Finally, the specific surface area of the materials was observed through nitrogen adsorption-desorption isotherms (Figure S1). Calculations revealed that the Brunauer-Emmett-Teller (BET) surface areas of MZIF-8 and magMZIF-8 were 973 m2·g–1 and 563 m2·g–1, respectively. This exhibited that magMZIF-8 possessed a significantly high surface area, providing abundant adsorption sites for exosomes and thereby enhancing the efficiency and yield of exosome isolation.
Synthesis and characterization of magMZIF-8. SEM images of (a) PS template, (b) MZIF-8, and (c) magMZIF-8. (d) TEM image of magMZIF-8. (e) EDX mapping images of magMZIF-8. (f) XRD patterns, (g) FT-IR spectra, (h) zeta potentials of Fe3O4, MZIF-8, magMZIF-8, and CZIF-8. (i) Magnetic hysteresis curve of Fe3O4 and magMZIF-8
Characterization and optimization of exosome isolation by magMZIF-8
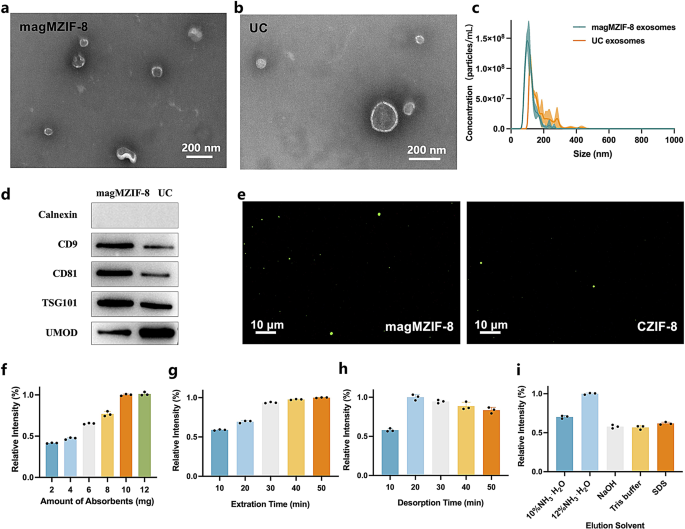
The process of separating urine exosomes by magMZIF-8 was depicted in Scheme 1b. On one hand, magMZIF-8 served as an adsorbent through dual adsorption mechanisms: firstly, by electrostatic interactions between its positively charged surface and the negatively charged exosomes; secondly, by reversible binding of zirconium in the material and phosphate groups on the exosome surface. Simultaneously, given its macropore diameter of 150 nm, magMZIF-8 also operated as a size exclusion agent, effectively removing impurities from urine. To ensure that the vesicles isolated by magMZIF-8 were indeed exosomes, these vesicles were characterized and compared with those isolated by UC. TEM was employed to examine the morphology of exosomes. As shown in Fig. 2a and b, both exosomes isolated by magMZIF-8 and UC exhibited typical cup-shaped structure. However, the magMZIF-8-isolate exosomes were more homogeneous and slightly smaller in particle size, which should be attributed to the exclusion effect of magMZIF-8. Nanoparticle tracking analysis (NTA) (Fig. 2c) revealed that magMZIF-8-isolated exosomes had an average diameter of 103.3 ± 4.2 nm, with D10, D50, and D90 distribution values at 84.4 nm, 109.8 nm, and 162.1 nm, respectively, consistent with the defined size range of exosomes [17,18,19]. And UC-isolated exosomes were concentrated at 117.7 ± 2.2 nm, with D10, D50, and D90 values of 112.9 nm, 147.3 nm, and 268.4 nm, respectively. Compared to ultracentrifugation, magMZIF-8 isolated smaller exosomes with a narrower particle size distribution, indicating that magMZIF-8 could remove the impurities of versicles with larger particle sizes in urine and reflecting the advantage of the size exclusion of magMZIF-8. The marker proteins of exosomes were characterized by Western blot (WB). As shown in Fig. 2d, the negative protein calnexin was not detected in exosomes obtained by both methods, indicating that the exosomes were not contaminated during the isolation process. The positive proteins CD9, CD81, and TSG101 were all detected, and their contents were higher in the magMZIF-8 method, suggesting that the extracellular vesicles isolated by both methods were indeed exosomes, and the exosome yield separated by the magMZIF-8 method was higher. This results indirectly reflected the importance of the MOAC affinity interaction and electrostatic interactions between magMZIF-8 and exosomes in improving the yield of exosome separation. Furthermore, as an impurity protein, the urinary modulation protein UMOD was less in the magMZIF-8 method, demonstrating the effective exclusion of impurities by the macropore in magMZIF-8. In addition, urine exosomes separated by UC were used as model exosomes and stained with the cell membrane fluorescent dye DiO. They were then incubated with CZIF-8 and magMZIF-8, and the exosome capture efficacy of magMZIF-8 was confirmed via inverted fluorescence microscopy. From Fig. 2e, magMZIF-8 exhibited distinct fluorescence while there was only a little fluorescence by CZIF-8, indicating that magMZIF-8 possessed strong exosome capture ability. In addition, confocal microscopy and TEM results of exosomes-magMZIF-8 complex were shown in Figure S17 and S18. Western blot analysis of BCa’s markers on exosomes was shown in Figure S19. To isolate more exosomes, the conditions that affect exosome isolation by magMZIF-8 were optimized using the bicinchoninic acid assay (BCA) method. The results were shown in Fig. 2f and j, where the y-axis represented the ratio of each parameter to the optimal parameter. Thanks to the robust electrostatic and MOAC interactions between magMZIF-8 and exosomes, only 10 mg of magMZIF-8 was required to isolate exosomes from 50 mL of urine, and the exosomes isolated were sufficient for subsequent exosome metabolomic analysis. The optimal adsorption and elution time were 40 min and 20 min, respectively, which meant that the exosome separation of 24 samples per batch only took 60 min, and the total 42 samples in this experiment could be completed in 2 h. Considering that the desorption between Zn-O and phosphate required an alkaline solution, we tested several commonly used MOAC alkaline elution solutions, and the optimal elution solution was 12% NH3·H2O. In addition, the zeta potential of magMZIF-8 in 12% NH3·H2O was − 25.96 mV (Figure S2), indicating that this elution solution also facilitates the disruption of electrostatic adsorption between magMZIF-8 and the exosomes. Moreover, the result also showed that SDS, which only disrupted electrostatic interactions, was not as effective as alkaline elution solutions which disrupted both electrostatic and MOAC interactions, further demonstrating the importance of these two interactions in the exosome separation process.
Characterization and optimization of exosome isolation by magMZIF-8. TEM images of exosome isolated by (a) magMZIF-8 and (b) ultracentrifugation. (c) NTA results and (d) Western blot results of exosomes isolated by magMZIF-8 and ultracentrifugation. (e) Fluorescence spectrophotometry results after co-incubation of magMZIF-8 (left) and CZIF-8 (right) with Dio-stained exosomes. Optimization results of (f) amounts of adsorbent, (g) extraction time, (h) desorption time and (i) elution solvent that affect exosome isolation by magMZIF-8
Early diagnosis of BCa based on exosome metabolomics
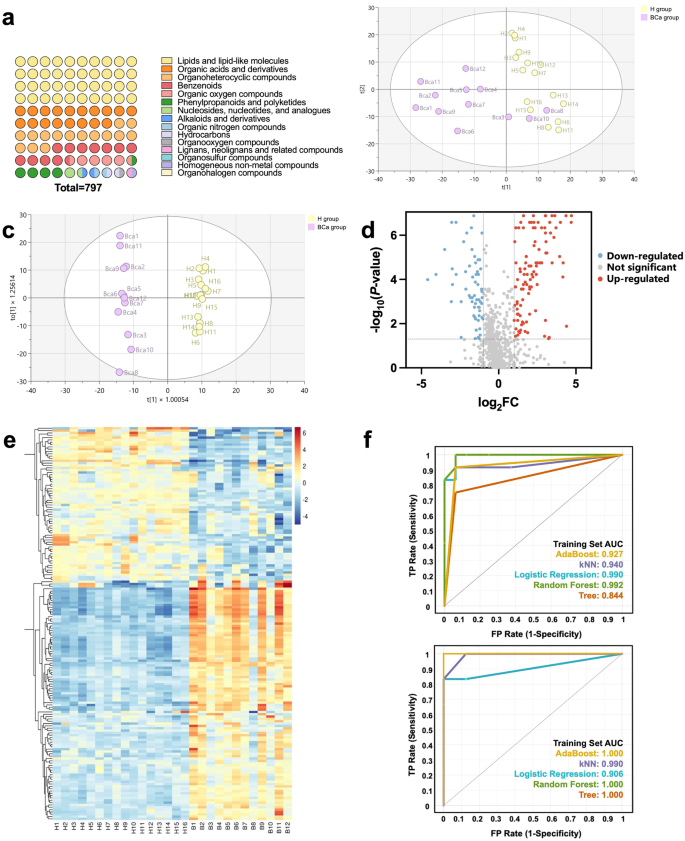
Exosomes carry abundant biological information and can more sensitively manifest abnormal changes [20, 21]. Urine is the body fluid most directly related to bladder cancer, and metabolomic analysis of urine exosomes can more directly and sensitively search and monitor biomarkers of BCa. In this study, 42 urine samples were collected, 24 from healthy individuals (H group) and 18 from early-stage bladder cancer patients (BCa group). Exosomes were isolated by magMZIF-8 and non-targeted metabolomic analysis was performed on the isolated exosomes combined with HPLC-TripleTOF-MS platform. Finally, the non-target metabolomics data were trained and tested based on five machine learning models. Among the 42 samples, 28 samples were randomly selected as the training set (n = 28, H/BCa, 16/12), and the remaining 14 samples were randomly selected as the test set (n = 14, H/BCa, 8/6). Detailed information was provided in Table S1 and Tables S2. The results of total ion chromatograms in LC-MS/MS can be found in the Supporting Information Figures S3 and S4. To minimize systematic errors, the entire experiment was monitored and calibrated using QC samples. Pearson’s Correlation Coefficient analysis affirmed the QC samples’ high reproducibility (Figure S5), evidencing stable HPLC-MS conditions and reliable detection data. Next, the complex data detected by HPLC-MS were preprocessed using XCMS to facilitate the selection of chromatographic peaks by metaX based on crucial information such as retention time, molecular weight, and peak area. Subsequently, metabolite identification was performed using HMDB, KEGG, and LIPID MAPS. The secondary identification results were shown in Fig. 3a, revealing a total of 797 metabolites identified. Based on the identified metabolites, multivariate statistical analysis was performed on the training set, comparing the H group and the BCa group. In the unsupervised Principal components analysis (PCA) model (Fig. 3b), the BCa8 and BCa10 samples were mixed with the H group. In the supervised orthogonal partial least squares-discriminant analysis (OPLS-DA) model (Fig. 3c), the H group and the BCa group were completely separated, highlighting significant metabolic discrepancies between the two groups and suggesting the biomarker potential of these differential metabolites. Additionally, the model exhibited robust predictive capability for classifying new samples. Figure S6 displayed the 200-permutation test outcomes for the OPLS-DA model, with R2 = (0.0, 0.914) and Q2 = (0.0 -0.382). The condition R2 > Q2 along the 0–1 x-axis range confirmed the OPLS-DA results were considered reliable and not overfitted. We next identified and analyzed differential metabolites between H group and BCa group. Differential metabolites were initially screened using the criteria of P < 0.05 and FC ≥ 1.2 or FC ≤ 1/1.2. The overall distribution of these metabolites was visually presented in the volcano plot shown in Fig. 3d, where pink and green indicated upregulated and downregulated metabolites, respectively, and gray denoted no significant difference. Furthermore, to refine the selection, we combined the VIP values from the OPLS-DA model and set VIP > 1 as an additional criterion. This resulted in the identification of 169 differential metabolites. Compared to healthy controls, the metabolite content in early BCa patients exhibited 103 up-regulated trends and 66 down-regulated trend. This result was shown in Fig. 3e in the form of heatmap, with red representing upregulation and blue representing downregulation. Then the peak intensity matrix of these 169 differential metabolites from the training set (n = 28, H/BCa, 16/12) was imported into the Orange software (version 3.36.1) to construct five machine learning models: Decision Tree (Tree), k-Nearest Neighbors (kNN), Support Vector Machine (SVM), Adaptive Boosting (AdaBoost), and Random Forest (RF). The classification accuracies (CA) of each model based on ten-fold cross-validation were 0.929, 0.929, 0.929, 0.964, 0.893, and 0.857, respectively, demonstrating robust accuracy and predictive capabilities for each model. This was further verified by the ROC curves of each machine learning model on the training set and the test set. As shown in Fig. 3f, AUC ranged from 0.844 to 0.997 and 0.875 to 1.000, respectively, and the AUC values were both high and similar, indicating that each machine learning model has strong classification and generalization ability with low risk of overfitting. Indeed, the classification accuracies, precisions, and recall rates of each machine learning model on the test set (n = 14, H/BCa, 8/6) were within the ranges of 0.929-1.000, 0.937-1.000, and 0.929-1.000, respectively. This highlighted the potential of differential metabolites in urinary exosomes as biomarkers for the early diagnosis of BCa.
Urinary exosome metabolomics for early diagnosis of bladder cancer. (a) Identified metabolite species (b) PCA score plot (c) OPLS-DA score plot and (d) Volcano plot based on exosome metabolites from H group and early BCa group in the training set (n = 28, H/BCa, 16/12). (e) Heatmap based on 169 differential metabolites. (f) ROC curves for five machine learning models used in the training set (n = 28, H/BCa, 16/12) and test set (n = 14, H/BCa, 8/6)
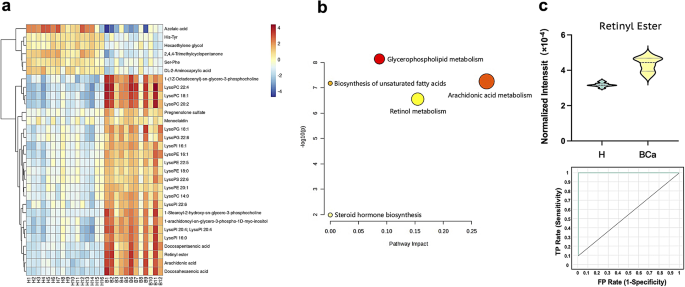
To gain a more intuitive understanding of the key differential metabolites between the H group and the BCa group, we selected the top 30 metabolites with the smallest P-values for heatmap analysis. And the result (Fig. 4a) demonstrated clear differentiation between the H and BCa groups by these 30 metabolites. The MS spectra of representative metabolites can be seen in the Supporting Information Figures S7–S16. Compared to the H group, 6 metabolites were downregulated and 24 were upregulated in the BCa group, with most metabolites belonging to lipid metabolites. To further understand the interactions between these key metabolites and other biomolecules, metabolic pathway analysis was performed on these 30 key differential metabolites, as shown in Fig. 4b, the metabolic pathway disorders caused by BCa include: glycerophospholipid metabolism, arachidonic acid metabolism, retinol metabolism, biosynthesis of unsaturated fatty acid, steroid hormone biosynthesis. The glycerophospholipid metabolism pathway, which exhibits the most significant changes, has been proven to be closely associated with the occurrence and development of BCa [22,23,24,25]. Glycerophospholipids, as essential components of cell membranes, not only maintain the integrity of cell structure but also play crucial roles as cellular signaling molecules in cell recognition, proliferation, migration, and apoptosis. For instance, the abnormal upregulation of LysoPI and LysoPS in BCa group may facilitate tumor cells to evade immune system recognition and clearance, thus promoting tumor growth and spread while hindering effective immune surveillance. Recently, researchers have gradually discovered disturbances in the arachidonic acid metabolism pathway in BCa patients [26,27,28,29]. Chronic inflammation is recognized as a key driver of tumor progression including BC, and arachidonic acid is a significant precursor to the production of inflammatory mediators, especially inflammatory mediators such as prostaglandins and leukotrienes produced by the cyclooxygenase (COX) pathway and lipoxygenase (LOX). Despite the discovery by researchers that retinol and retinoids are crucial in the prevention and treatment of BC [30, 31], this study is the first to identify abnormalities in the retinol metabolism pathway in early BCa patients from the perspective of exosome metabolomics. Interestingly, retinyl ester, which contributes to the abnormal retinol metabolism pathway in this study, exhibited the most significant P-value difference between the H group and BCa group. Remarkably, in the decision tree model of machine learning, retinyl ester alone was sufficient to distinguish healthy controls and BCa patients (AUC = 1.000), underscoring its potential as early diagnostic biomarkers for BCa. Compared to healthy controls, the contents of retinyl ester were significantly upregulated in early BCa patients (Fig. 4c). This may be attributed to multiple factors. Firstly, retinyl esters serve as crucial regulators of cell growth and differentiation. Metabolically active bladder cancer cells may attempt to increase their stores of retinyl esters to meet the needs of their survival and proliferation. Secondly, the development of bladder cancer generates a large amount of reactive oxygen species (ROS). Retinyl esters, with antioxidant properties, likely represent a defensive mechanism against oxidative stress-induced cellular damage. Lastly, the tumor microenvironment may alter local retinol metabolism, including the intake, storage, and release of retinyl esters, resulting in their accumulation in tumor cells. In conclusion, these mechanisms may interact and overlap, ultimately leading to the upregulation of retinyl esters in patients with BCa. This study is the first to demonstrate significant differences in retinyl esters between healthy controls and patients with BCa from the metabolomics perspective, which could exhibit high classification and prediction capabilities.
Key differential metabolites and pathways based on exosome untargeted metabolomics. (a) Heatmap and (b) Pathway analysis of the key differential metabolites from H group and early BCa group in the training set (n = 28, H/BCa, 16/12). (c) Violin plots and ROC plots of retinyl ester l in the H and early BCa groups


