

According to new data from TeleGeography’s Transport Networks Research Service, global bandwidth demand continues to climb.
But, as has been the story for the last several years, this growth is coming at a slower and slower rate. Here’s what this says about long-haul networks in 2025.
International Bandwidth Demand Trends
Bandwidth demand growth seemed unstoppable for a long time. As recently as 2020, year-on-year demand increased 45%. Fast-forward to 2024, and that pace is down to 29%.
Worldwide International Bandwidth Growth

Despite the slowdown in the annual growth rate, our 2024 data represents a steady 32% compound annual growth rate (CAGR). Not to mention a tripling demand between 2020 and 2024, surpassing 6.4 Pbps. That’s still a lot.
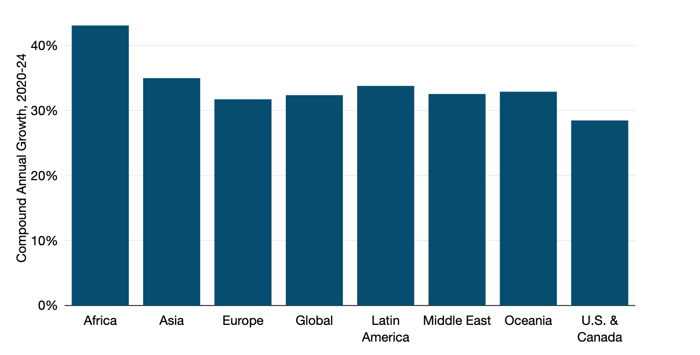
On a regional level, most parts of the world have seen very comparable growth at about 32-35% CAGR since 2020.
As the chart below shows, Africa outpaces other regions with more than 40% CAGR demand growth, and the mature U.S. market falls slightly below the average with about 29% growth in bandwidth demand.
Used International Bandwidth Growth by Region
 Source: © 2025 TeleGeography
The Evolving Role of Content Providers
Content and cloud providers—specifically a handful of companies like Google, Meta, Microsoft, and Amazon—overwhelmingly account for most of the world’s international bandwidth usage.
As recently as 2016, internet backbone providers accounted for the majority of demand. Not anymore. In 2024, content and cloud networks accounted for almost three-quarters of all bandwidth demand.
While content providers’ share of total demand varies by route, it’s becoming dominant just about everywhere. On the massive trans-Atlantic, trans-Pacific, and intra-Asian routes, these networks account for at least 80% of bandwidth demand.
Share of Used Bandwidth by Category for Major Routes
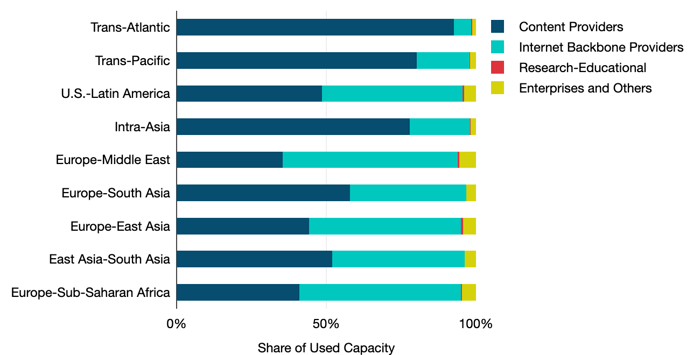 Notes: Data shows used bandwidth as of year-end 2024. Source: © 2025 TeleGeography
A few smaller routes, such as Europe-East Asia and Europe-Sub-Saharan Africa, are still driven by internet backbone demand, but the dynamic is shifting even in these locations.
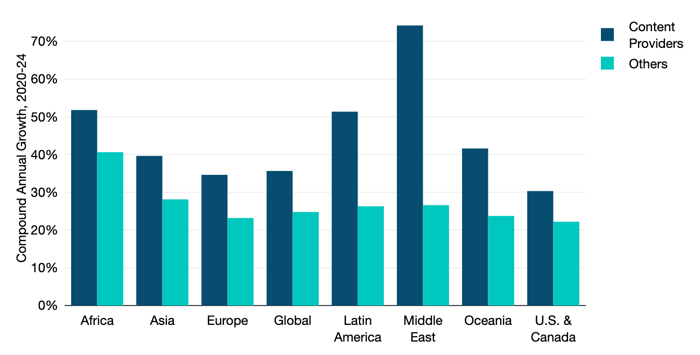
This is illustrated below. This chart shows us that content provider demand growth is outpacing other network sources on all of the route groupings we track.
Consider Latin America, where content demand growth is almost double that of other sources. Within the next year, content providers will account for the outright majority of demand on U.S.-Latin American routes.
Content Providers vs. Others Bandwidth Growth by Region
Source: © 2024 TeleGeography
As might be expected, content provider demand growth is fastest in regions where carriers are still dominant, like Africa, Latin America, and the Middle East. But there’s no part of the globe where content demand growth isn’t outpacing that of internet backbone providers.
Download the new Transport Networks Executive Summary to keep reading our latest analysis on the state of global network infrastructure.
