Design principle of the electrochemical biosensor
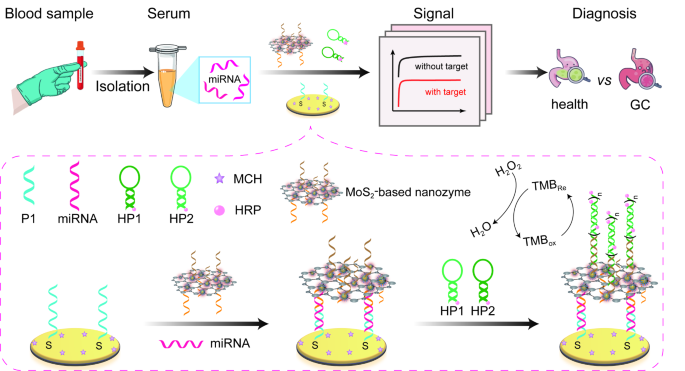
As illustrated in Scheme 1, P1 was firstly assembled on electrode surface via Au-S bond. After passivating the electrode surface with MCH, target miR-19b-3p and P2-HCR-I/MoS2-Au@Pt nanoprobes were introduced to construct P2-HCR-I/MoS2-Au@Pt/miR-19b-3p/P1/Au due to the formation of P1-miR-19b-3p-P2 sandwiched structure. Then, the assembled HCR-I triggered the occurrence of HCR reaction in the presence of HRP-labelled both HP1 and HP2. As a result, a large number of HRP were assembled on the surface of electrode surface with the occurrence of HCR reaction. Therefore, the assembled MoS2-Au@Pt nanozymes and HRP can efficiently co-catalyze H2O2-TMB reaction to generate outstanding electrochemical signal, achieving the purpose of signal amplification. In this study, a triple signal amplification strategy was designed for miR-19b-3p detection. MoS2-Au@Pt nanocomposites are not only used as nanoprobes to load P2 and HCR-I for recognizing and capturing miR-19b-3p, but also are employed as nanozymes to catalyze H2O2-TMB reaction. At this moment, this biosensor achieved the first signal amplification. In the presence of HP1 and HP2, a typical HCR reaction was initiated by HCR-I. Accompanied by HCR reaction, a super-long DNA double-stranded structure labelled with HRP was obtained on electrode surface, resulting in the second signal amplification. The introduced HRP catalyze H2O2-TMB reaction to achieve the third signal amplification. Coupled with the triple signal amplification, this proposed biosensor can qualitatively and quantitatively detect miR-19b-3p with satisfactory results.
Characterization of MoS2, MoS2-AuNPs and MoS2-Au@Pt
Transmission electron microscope (TEM) was used to characterize the morphologies of as-prepared MoS2, MoS2-AuNPs and MoS2-Au@Pt nanomaterials. As shown in Fig. S1, gold nanoparticles (AuNPs) with an average diameter of 8.1 ± 0.7 nm were distributed on the surface of MoS2 nanosheets, forming MoS2-AuNPs nanocomposites. Subsequently, MoS2-AuNPs nanocomposites were used as nanoseeds to prepare MoS2-Au@Pt nanocomposites. Obviously, 20.1 ± 0.5 nm core-shell Au@Pt bimetallic nanoparticles were supported on MoS2 surface, proving that the successful synthesis of MoS2-Au@Pt nanocomposites.
Zeta potential analysis was applied to evaluate the charges of the nanocomposite suspensions. As observed in Fig. S2, the zeta potential of MoS2 nanosheets was − 22.2 mV. Compared with MoS2 nanosheets, the zeta potential of MoS2-AuNPs nanocomposites was positively shifted to -13.4 mV, suggesting that the successful decoration of AuNPs [31, 32]. When Au@Pt bimetallic nanoparticles supported on the surface of MoS2 nanosheets, the zeta potential increased to 11.3 mV, which is ascribed to the positively charged surfactant adsorbed on the nanomaterials surface [33].
Characterization of P2-HCR-I/MoS2-Au@Pt nanoprobes
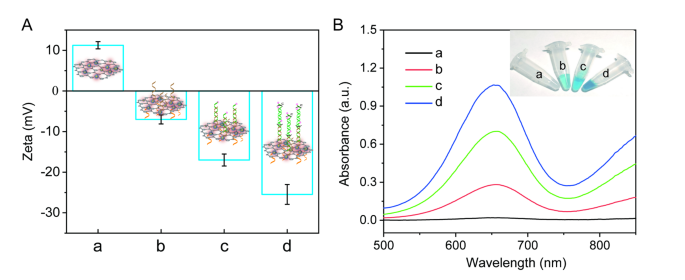
Zeta potential was used to verify the preparation of P2-HCR-I/MoS2-Au@Pt nanoprobes and the occurrence of HCR reaction. As observed in Fig. 1A, the zeta potential of MoS2-Au@Pt, P2-HCR-I/MoS2-Au@Pt, HP1/P2-HCR-I/MoS2-Au@Pt and HP1-HP2/P2-HCR-I/MoS2-Au@Pt were 11.2 mV, -7.0 mV, -17.0 mV and − 25.5 mV, respectively, suggesting that the successful preparation of nanoprobes and the occurrence of HCR reaction on nanocomposites’ surface. The reason is ascribed to the negatively charged DNA were assembled on the surface of MoS2-Au@Pt nanocomposites. The more DNA assembled on nanocomposites’ surface, the zeta potential shifted more negatively.
Moreover, the catalytic activities of MoS2-Au@Pt nanoprobes and nanoprobe-assisted signal amplification system were characterized by using H2O2-TMB reaction system (Fig. 1B). No absorption peak of H2O2-TMB solution was obtained, suggesting that no catalytic reaction was occurred (curve a). An obvious absorption peak at 652 nm and a blue solution were observed when MoS2-Au@Pt nanocomposites was added into H2O2-TMB solution (Fig. S3). This phenomenon efficiently proves that MoS2-Au@Pt nanocomposite has a peroxidase-like enzyme activity to catalyze H2O2-TMB reaction. Once P2 and HCR-I were co-assembled on the surface of MoS2-Au@Pt nanocomposites to form P2-HCR-I/MoS2-Au@Pt nanoprobes, the absorption peak intensity of nanoprobes decreased about 38.3% compared with that of MoS2-Au@Pt nanocomposites, indicating that P2 and HCR-I partly blocked the catalytic sites of MoS2-Au@Pt nanocomposites (Fig. S3, curve b in Fig. 1B). To obtain high detection performance, both HP1 and HP2 labelled with HRP were introduced to improve the catalytic ability and accomplish multiple signal amplification. When HP1 was hybridized on the surface of nanoprobes, reaction solution became bluer and the absorption peak intensity increased to 0.7 (curve c). The highest absorption peak intensity (1.0) and the bluest solution colour were observed when both HP1 and HP2 were added into the reaction strategy (curve d), indicating that HCR reaction was successfully occurred on nanocomposites’ surface. The largest response was ascribed to the synergistic effect of MoS2-Au@Pt nanozymes and HRP.
(A) The zeta potentials of (a) MoS2-Au@Pt, (b) P2-HCR-I/MoS2-Au@Pt, (c) HP1/P2-HCR-I/MoS2-Au@Pt and (d) HP1-HP2/P2-HCR-I/MoS2-Au@Pt. (B) UV-visible absorption spectra of (a) H2O2-TMB, (b) H2O2-TMB + P2-HCR-I/MoS2-Au@Pt, (c) H2O2-TMB + HP1/P2-HCR-I/MoS2-Au@Pt and (d) H2O2-TMB + HP1-HP2/P2-HCR-I/MoS2-Au@Pt. Inset: the corresponding photograph of different products in H2O2-TMB solution
Characterization of preparation process of the electrochemical biosensor
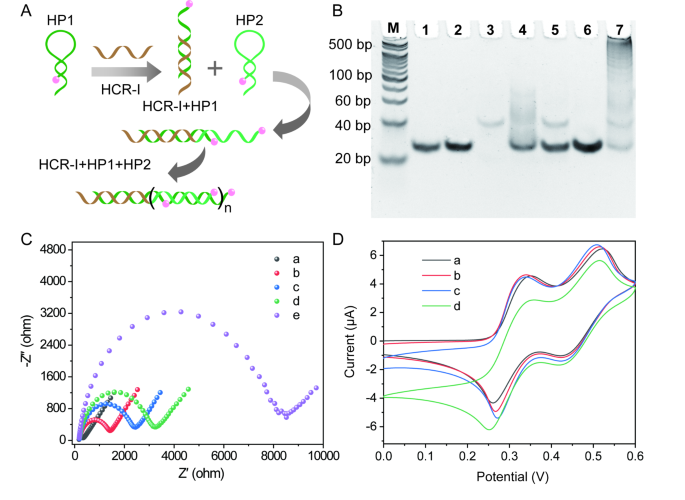
As shown in Fig. 2A, the initiator DNA (HCR-I) can trigger the self-assembly of HP1 and HP2 to generate long DNA double-strands (dsDNA). The HCR product was verified by 8% native polyacrylamide gel electrophoresis (Fig. 2B). Obviously, a single band was observed from lane 1 to lane 3, which is corresponding to HP1, HP2 and HCR-I, respectively. As expectedly, HCR-I can open the hairpin structure of HP1 to form dsDNA structure via hybridization reaction, generating a new band in lane 4. Meanwhile, two bands were obtained in lane 5, suggesting that HCR-I doesn’t hybridize with HP2. Moreover, HP1 and HP2 coexist in the reaction system without the trigger of HCR-I (lane 6). In the presence of HCR-I, HCR-I initiates HCR reaction to produce long dsDNA. Correspondingly, ladder bands appeared in lane 7.
Electrochemical impedance spectroscopy (EIS) and cyclic voltammetry (CV) were performed to monitor the fabrication process of this electrochemical biosensor. Generally, the electron transfer resistance (Rct) suggests the interfacial impedance of different modified electrodes. If the negative charges of P1 and miR-19b-3p were assembled on the bare gold electrode surface (curve a, Fig. 2C), the Rct of P1/Au (curve b, Fig. 2C) and miR-19b-3p/P1/Au (curve c, Fig. 2C) increased to 1407.4 Ω and 2426.2 Ω, respectively. With the assembly of P2-HCR-I/MoS2-Au@Pt nanoprobes, the Rct value was increased to 3207.5 Ω (curve d, Fig. 2C). Once the occurrence of HCR reaction, the introduced HP1 and HP2 caused a great increase in the Rct value of HP1-HP2/P2-HCR-I/MoS2-Au@Pt/miR-19b-3p/P1/Au (8483.4 Ω, curve e, Fig. 2C). These increase of Rct values proved the successful preparation of the designed electrochemical biosensor. Electrochemical behaviors of different preparation processes were also characterized by CV in [Fe(CN)6]4−/3−solution (Fig. S4). Notably, CV results were in agreement with EIS results, furtherly proving that the designed biosensor have been successfully constructed.
The electrochemical behaviour of this biosensor was also studied in the TMB and H2O2 mixture solution. As illustrated in Fig. 2D, two pairs of redox peaks were observed at P1/Au, which was ascribed to the typical two electron redox reaction of TMB in the presence of H2O2 (curve a). After the successful assembly of MoS2-based nanoprobes, a few increase in the peak current at P2-HCR-I/MoS2-Au@Pt/miR-19b-3p/P1/Au was observed (curve b). The assembled MoS2-based nanoprobes have electrocatalytic activity, which can catalyze the reaction of H2O2-TMB. When HRP-labelled HP1 and HRP-labelled HP2 were introduced on the electrode surface, an obvious amplified electrochemical responses were obtained at HP1/P2-HCR-I/MoS2-Au@Pt/miR-19b-3p/P1/Au (curve c) and HP1-HP2/P2-HCR-I/MoS2-Au@Pt/miR-19b-3p/P1/Au (curve d), respectively. The peak currents were greatly depended on the amount of HRP, which can efficiently catalyze H2O2-TMB reaction to generate an outstanding electrochemical signal. All experimental data suggested that the synergistic effect of MoS2-based nanoprobes, HCR reaction and HRP enzyme can amplify electrochemical signal, which is beneficial for trace target molecules detection.
(A) Schematic diagram of HCR process. (B) Different products were characterized by gel electrophoresis. From lane M to lane 7 is 20 bp DNA ladder marker, HP1, HP2, HCR-I, HCR-I + HP1, HP2 + HCR-I, HP1 + HP2, HCR-I + HP1 + HP2, respectively. (C) EIS curves of (a) bare Au, (b) P1/Au, (c) miR-19b-3p/P1/Au, (d) P2-HCR-I/MoS2-Au@Pt/miR-19b-3p/P1/Au, (e) HP1-HP2/P2-HCR-I/MoS2-Au@Pt/miR-19b-3p/P1/Au in 5 mM K3[Fe(CN)6]/K4[Fe(CN)6] solution containing 0.1 M KCl. (D) CV curves of (a) P1/Au, (b) P2-HCR-I/MoS2-Au@Pt/miR-19b-3p/P1/Au, (c) HP1/P2-HCR-I/MoS2-Au@Pt/miR-19b-3p/P1/Au, (d) HP1-HP2/P2-HCR-I/MoS2-Au@Pt/miR-19b-3p/P1/Au in H2O2-TMB solution
Feasibility of signal amplification strategy
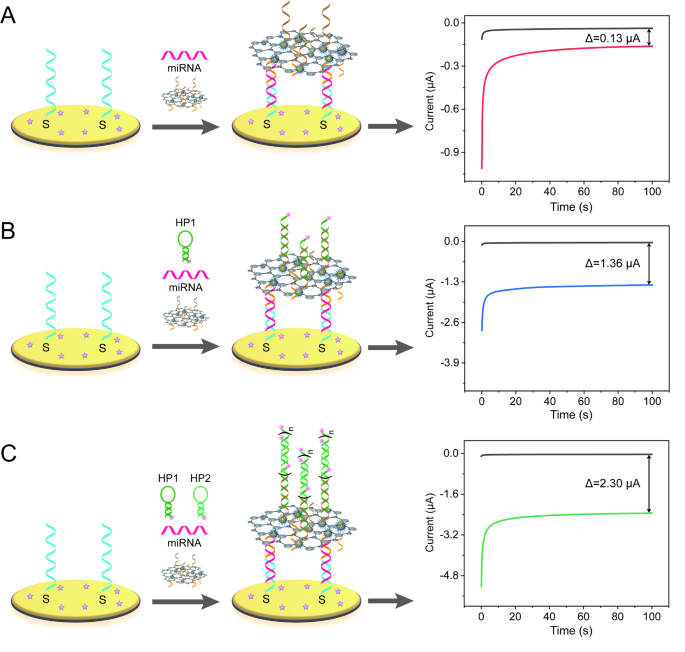
The signal amplification effect of this biosensor was investigated. As mentioned in Scheme 1, MoS2-based nanozymes, HCR and HRP were used to amplify electrochemical signal. For efficiently realize the signal amplification effect, two control groups included single signal amplification (MoS2-based nanoprobe) and double signal amplification (MoS2-based nanoprobe and HRP) were designed for comparison (Fig. 3). For the same concentration of miR-19b-3p detection (100 pM), the peak currents variations (ΔI = ImiRNA − Ino miRNA) of single signal amplification strategy were 0.13 µA (Fig. 3A). By contrast, the ΔI of double signal amplification was reached to 1.36 µA, which is almost 10.46 times than that amplified by single signal amplification (Fig. 3B). For triple signal amplification strategy, the ΔI was about 2.30 µA, which is about 17.69 times and 1.69 times than that of single signal amplification and double signal amplification strategy, respectively, suggesting that the triple signal amplification has the best electrochemical response (Fig. 3C).
Electrochemical biosensors with different signal amplification strategies (A) single signal amplification (MoS2-based nanoprobes), (B) double signal amplification (MoS2-based probes + HRP catalytic reaction), (C) triple signal amplification (MoS2-based nanoprobe + HCR reaction + HRP catalytic reaction) for 100 pM miR-19b-3p detection in H2O2-TMB solution. The initial potential was 150 mV and the runtime was 100 s
Analytical performance of the electrochemical biosensor
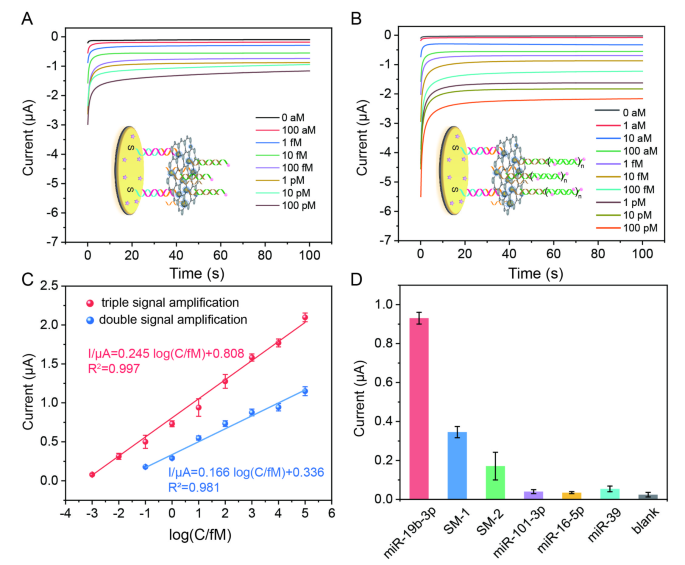
To obtain the optimal performance of the electrochemical biosensor, the experimental conditions were optimized. As displayed in Fig. S5A, the optimum incubation time of MoS2-Au@Pt-based nanoprobes and the reaction time of HCR were selected as 80 min and 80 min, respectively. Under the optimal conditions, the analytical performance of electrochemical biosensors coupled with double signal amplification (MoS2-based nanoprobes + HRP) and triple signal amplification (MoS2-based nanoprobe + HCR + HRP) for miR-19b-3p detection was tested by using amperometric method, respectively. As shown in Fig. 4A and B, the currents of the biosensors amplified by double signal amplification and triple signal amplification were increasing with the addition of miR-19b-3p, respectively. From the amperometric curves, two linear relationships between the current value at the 100th second and the logarithm of miR-19b-3p concentrations were obtained with equations of \(\:I/{\upmu\:}\text{{\rm\:A}}=0.245\text{log}\left(C/fM\right)+0.808\) (R2 = 0.997) and \(\:I/{\upmu\:}\text{{\rm\:A}}=0.166\text{log}\left(C/fM\right)+0.336\) (R2 = 0.981) for triple signal amplification- and double signal amplification-based biosensors, respectively (Fig. 4C). Obviously, the triple signal amplification-based biosensor has wider dynamic range (1 aM-100 pM vs. 100 aM-100 pM), larger electrochemical response (0.50 µΑ vs. 0.18 µΑ for 100 aM miR-19b-3p detection) and lower detection limit (0.7 aM vs. 37.4 aM) than the double signal amplification-based biosensor. The analytical performance of this triple signal amplification-based biosensor is better than some published works for miRNA detection (Table S2). The selectivity of this triple signal amplification-based biosensor was tested. As shown in Fig. 4D, the current of this biosensor for 10 fM miR-19b-3p detection (0.93 µΑ) is about 2.7 times, 5.4 times, 23.3 times, 26.6 times, 17.2 times than this biosensor for 10 pM two single-base mismatched miR-19b-3p (SM-1, SM-2), miR-101-3p, miR-16-5p, miR-39 detection, respectively, suggesting that this biosensor can efficiently distinguish target miR-19b-3p from even a single-base mismatched microRNA sequence. The reproducibility of the biosensor was studied by using ten independent biosensors. As shown in Fig. S6, the relative standard deviation (RSD) of intra- and inter-assays were 3.89% and 1.70%, respectively, suggesting that the biosensor has good reproducibility. The storage stability of this biosensor was studied by storing the developed electrodes at 4 °C in the refrigerator. Experimental results showed that the response current of this biosensor was about 92.8% of the initial signal response after 8 days storage, indicating that the biosensor has excellent stability (Fig. S7).
(A) I-t responses of the electrochemical biosensor coupled with double signal amplification strategies for different concentrations of miR-19b-3p detection in H2O2-TMB solution. (B) I-t responses of the triple signal amplification-based biosensor for different concentrations of miR-19b-3p detection in H2O2-TMB solution. The initial potential was 150 mV and the runtime was 100 s. (C) The linear relationships between the current value and the logarithm of miR-19b-3p concentrations. (D) The selectivity of the biosensor for the detection of 10 fM miR-19b-3p, 10 pM SM-1, 10 pM SM-2, 10 pM miR-101-3p, 10 pM miR-16-5p, and 10 pM miR-39, respectively. The illustrated error bars represent the standard deviations of at least three independent measurements (n = 3)
Analysis of miR-19b-3p in clinical samples
At first, simulated serum sample was used to evaluate the practical analytical ability of this biosensor. Typically, different concentrations (100 aM, 1 fM, 10 fM, 100 fM and 1 pM) of miR-19b-3p were added in 1% human serum to simulate the real samples. As displayed in Table 1, the recoveries and relative standard deviation (RSD) of this biosensor are about 95.2-102.5% and 2.1-5.8%, respectively, proving that the proposed biosensor has a promising application in clinical detection.
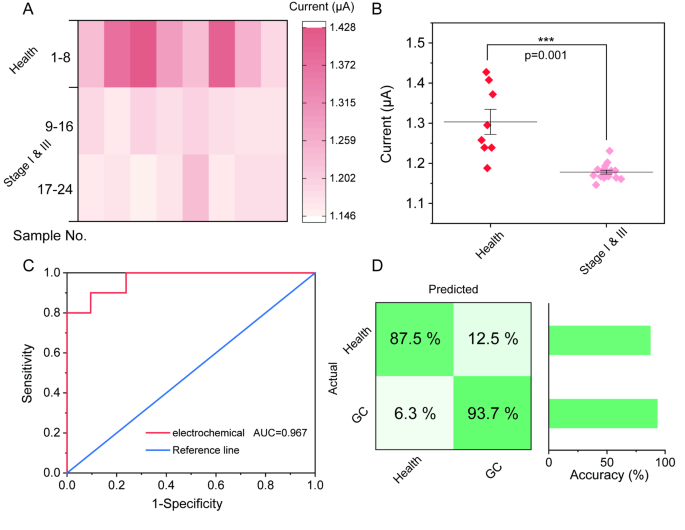
Based on simulated results, clinical samples were collected to further evaluate the practical application of the electrochemical biosensor. Human serum samples from 16 GC patients at stages I & III and 8 negative control samples were collected and extracted as clinical samples. The concentrations of miR-19b-3p in the clinical samples were determined both by classical qRT-PCR and this biosensor (Table S3). The results in Fig. 5A and Fig. S8 clearly show that the expression level of miR-19b-3p in GC stage I & III patients is lower than that in healthy individuals (Health), indicating that miR-19b-3p is downregulated in GC patients [15, 16, 34, 35]. According to the significant analysis result, the proposed electrochemical biosensor can efficiently distinguish gastric cancer (GC) patients and healthy individuals (Fig. 5B). This conclusion is good agreement with qRT-PCR results, which are recorded in Fig. S9. Moreover, the detection efficacy was also investigated by using a receiver operating characteristic (ROC) curve (Fig. 5C). Notably, the area under the curve (AUC) of this electrochemical biosensor is 0.967. Further analysis showed that the false positive rate was 6.3% and the false negative rate was 12.5%, proving that the accuracies for classification of Health versus GC. (Fig. 5D). Above results further suggested that the proposed electrochemical sensing strategy holds a great potential application in the clinical diagnosis of gastric cancer.
Analysis of miR-19b-3p expression levels in clinical blood samples by the proposed biosensor. (A) Heat map of electrochemical signal of this biosensor for miR-19b-3p detection in the blood of Healthy people, GC stage I & III patients. (B) Significant reduction in electrochemical signal for the GC stage I & III patients compared with healthy people (p = 0.001). (C) ROC analysis of miR-19b-3p in clinical blood samples by the electrochemical biosensor. (D) Confusion matrix summarizing the GC diagnosis results in a validation cohort


