What is load testing and why does it matter?

Load testing is a critical process for any database or data service, including Rockset. By doing load testing, we aim to assess the system’s behavior under both normal and peak conditions. This process helps in evaluating important metrics like Queries Per Second (QPS), concurrency, and query latency. Understanding these metrics is essential for sizing your compute resources correctly, and ensuring that they can handle the expected load. This, in turn, helps in achieving Service Level Agreements (SLAs) and ensures a smooth, uninterrupted user experience. This is especially important for customer-facing use cases, where end users expect a snappy user experience. Load testing is sometimes also called performance or stress testing.
“53% of visits are likely to be abandoned if pages take longer than 3 seconds to load” — Google
Rockset compute resources (called virtual instances or VIs) come in different sizes, ranging from Small to 16XL, and each size has a predefined number of vCPUs and memory available. Choosing an appropriate size depends on your query complexity, dataset size and selectivity of your queries, number of queries that are expected to run concurrently and target query performance latency. Additionally, if your VI is also used for ingestion, you should factor in resources needed to handle ingestion and indexing in parallel to query execution. Luckily, we offer two features that can help with this:
- Auto-scaling – with this feature, Rockset will automatically scale the VI up and down depending on the current load. This is important if you have some variability in your load and/or use your VI to do both ingestion and querying.
- Compute-compute separation – this is useful because you can create VIs that are dedicated solely for running queries and this ensures that all of the available resources are geared towards executing those queries efficiently. This means you can isolate queries from ingest or isolate different apps on different VIs to ensure scalability and performance.
We recommend doing load testing on at least two virtual instances – with ingestion running on the main VI and on a separate query VI. This helps with deciding on a single or multi-VI architecture.
Load testing helps us identify the limits of the chosen VI for our particular use case and helps us pick an appropriate VI size to handle our desired load.
Tools for load testing
When it comes to load testing tools, a few popular options are JMeter, k6, Gatling and Locust. Each of these tools has its strengths and weaknesses:
- JMeter: A versatile and user-friendly tool with a GUI, ideal for various types of load testing, but can be resource-intensive.
- k6: Optimized for high performance and cloud environments, using JavaScript for scripting, suitable for developers and CI/CD workflows.
- Gatling: High-performance tool using Scala, best for complex, advanced scripting scenarios.
- Locust: Python-based, offering simplicity and rapid script development, great for straightforward testing needs.
Each tool offers a unique set of features, and the choice depends on the specific requirements of the load test being conducted. Whichever tool you use, be sure to read through the documentation and understand how it works and how it measures the latencies/response times. Another good tip is not to mix and match tools in your testing – if you are load testing a use case with JMeter, stick with it to get reproducible and trustworthy results that you can share with your team or stakeholders.
Rockset has a REST API that can be used to execute queries, and all tools listed above can be used to load test REST API endpoints. For this blog, I’ll focus on load testing Rockset with Locust, but I will provide some useful resources for JMeter, k6 and Gatling as well.
Setting up Rockset and Locust for load testing
Let’s say we have a sample SQL query that we want to test and our data is ingested into Rockset. The first thing we usually do is convert that query into a Query Lambda – this makes it very easy to test that SQL query as a REST endpoint. It can be parametrized and the SQL can be versioned and kept in one place, instead of going back and forth and changing your load testing scripts every time you need to change something in the query.
Step 1 – Identify the query you want to load test
In our scenario, we want to find the most popular product on our webshop for a particular day. This is what our SQL query looks like (note that :date is a parameter which we can supply when executing the query):
--top product for a particular day
SELECT
    s.Date,
    MAX_BY(p.ProductName, s.Count) AS ProductName,
    MAX(s.Count) AS NumberOfClicks
FROM
    "Demo-Ecommerce".ProductStatsAlias s
    INNER JOIN "Demo-Ecommerce".ProductsAlias p ON s.ProductID = CAST(p._id AS INT)
WHERE
    s.Date = :date
GROUP BY
    1
ORDER BY
    1 DESC;

Step 2 – Save your query as a Query Lambda
We’ll save this query as a query lambda called LoadTestQueryLambda which will then be available as a REST endpoint:
https://api.usw2a1.rockset.com/v1/orgs/self/ws/sandbox/lambdas/LoadTestQueryLambda/tags/latest
curl --request POST \
--url https://api.usw2a1.rockset.com/v1/orgs/self/ws/sandbox/lambdas/LoadTestQueryLambda/tags/latest \
-H "Authorization: ApiKey $ROCKSET_APIKEY" \
-H 'Content-Type: application/json' \
  -d '{
    "parameters": [
      {
        "name": "days",
        "type": "int",
        "value": "1"
      }
    ],
      "virtual_instance_id": ""
  }' \
 | python -m json.tool
Step 3 – Generate your API key
Now we need to generate an API key, which we’ll use as a way for our Locust script to authenticate itself to Rockset and run the test. You can create an API key easily through our console or through the API.
Step 4 – Create a virtual instance for load testing
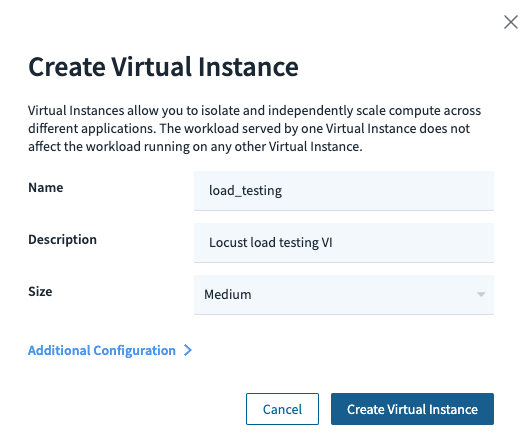
Next, we need the ID of the virtual instance we want to load test. In our scenario, we want to run a load test against a Rockset virtual instance that’s dedicated only to querying. We spin up an additional Medium virtual instance for this:

Once the VI is created, we can get its ID from the console:

Step 5 – Install Locust
Next, we’ll install and set up Locust. You can do this on your local machine or a dedicated instance (think EC2 in AWS).
$ pip install locust
Step 6 – Create your Locust test script
Once that’s done, we’ll create a Python script for the Locust load test (note that it expects a ROCKSET_APIKEY environment variable to be set which is our API key from step 3).
We can use the script below as a template:
import os
from locust import HttpUser, task, tag
from random import randrange

class query_runner(HttpUser):
    ROCKSET_APIKEY = os.getenv('ROCKSET_APIKEY') # API key is an environment variable

    header = {"authorization": "ApiKey " + ROCKSET_APIKEY}

    def on_start(self):
        self.headers = {
            "Authorization": "ApiKey " + self.ROCKSET_APIKEY,
            "Content-Type": "application/json"
        }
        self.client.headers = self.headers
        self.host="https://api.usw2a1.rockset.com/v1/orgs/self" # replace this with your region's URI
        self.client.base_url = self.host
        self.vi_id = '' # replace this with your VI ID

    @tag('LoadTestQueryLambda')
    @task(1)
    def LoadTestQueryLambda(self):
        # using default params for now
        data = {
            "virtual_instance_id": self.vi_id
        }
        target_service="/ws/sandbox/lambdas/LoadTestQueryLambda/tags/latest" # replace this with your query lambda
        result = self.client.post(
            target_service,
            json=data
        )
Step 7 – Run the load test
Once we set the API key environment variable, we can run the Locust environment:
export ROCKSET_APIKEY=
locust -f my_locust_load_test.py --host https://api.usw2a1.rockset.com/v1/orgs/self
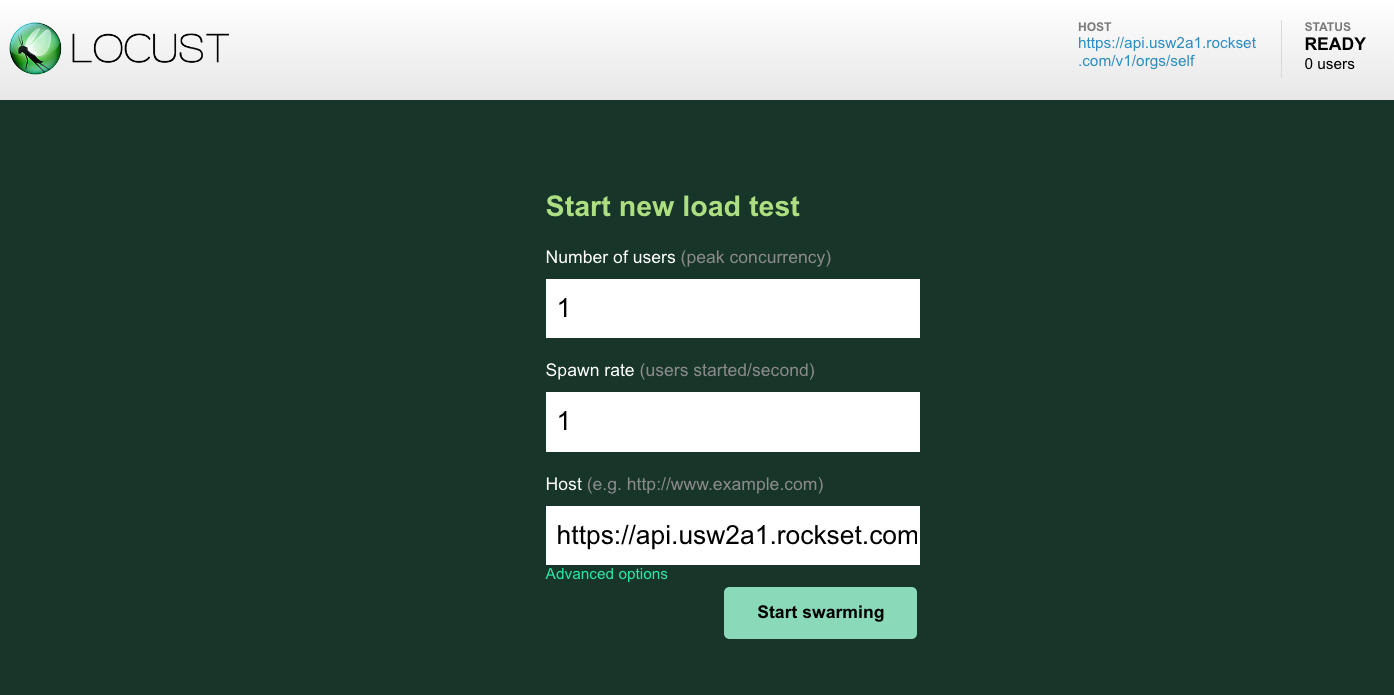
And navigate to: http://localhost:8089 where we can start our Locust load test:

Let’s explore what happens once we hit the Start swarming button:
- Initialization of simulated users: Locust starts creating virtual users (up to the number you specified) at the rate you defined (the spawn rate). These users are instances of the user class defined in your Locust script. In our case, we’re starting with a single user but we will then manually increase it to 5 and 10 users, and then go down to 5 and 1 again.
- Task execution: Each virtual user starts executing the tasks defined in the script. In Locust, tasks are typically HTTP requests, but they can be any Python code. The tasks are picked randomly or based on the weights assigned to them (if any). We have just one query that we’re executing (our
LoadTestQueryLambda). - Performance metrics collection: As the virtual users perform tasks, Locust collects and calculates performance metrics. These metrics include the number of requests made, the number of requests per second, response times, and the number of failures.
- Real-time statistics update: The Locust web interface updates in real-time, showing these statistics. This includes the number of users currently swarming, the request rate, failure rate, and response times.
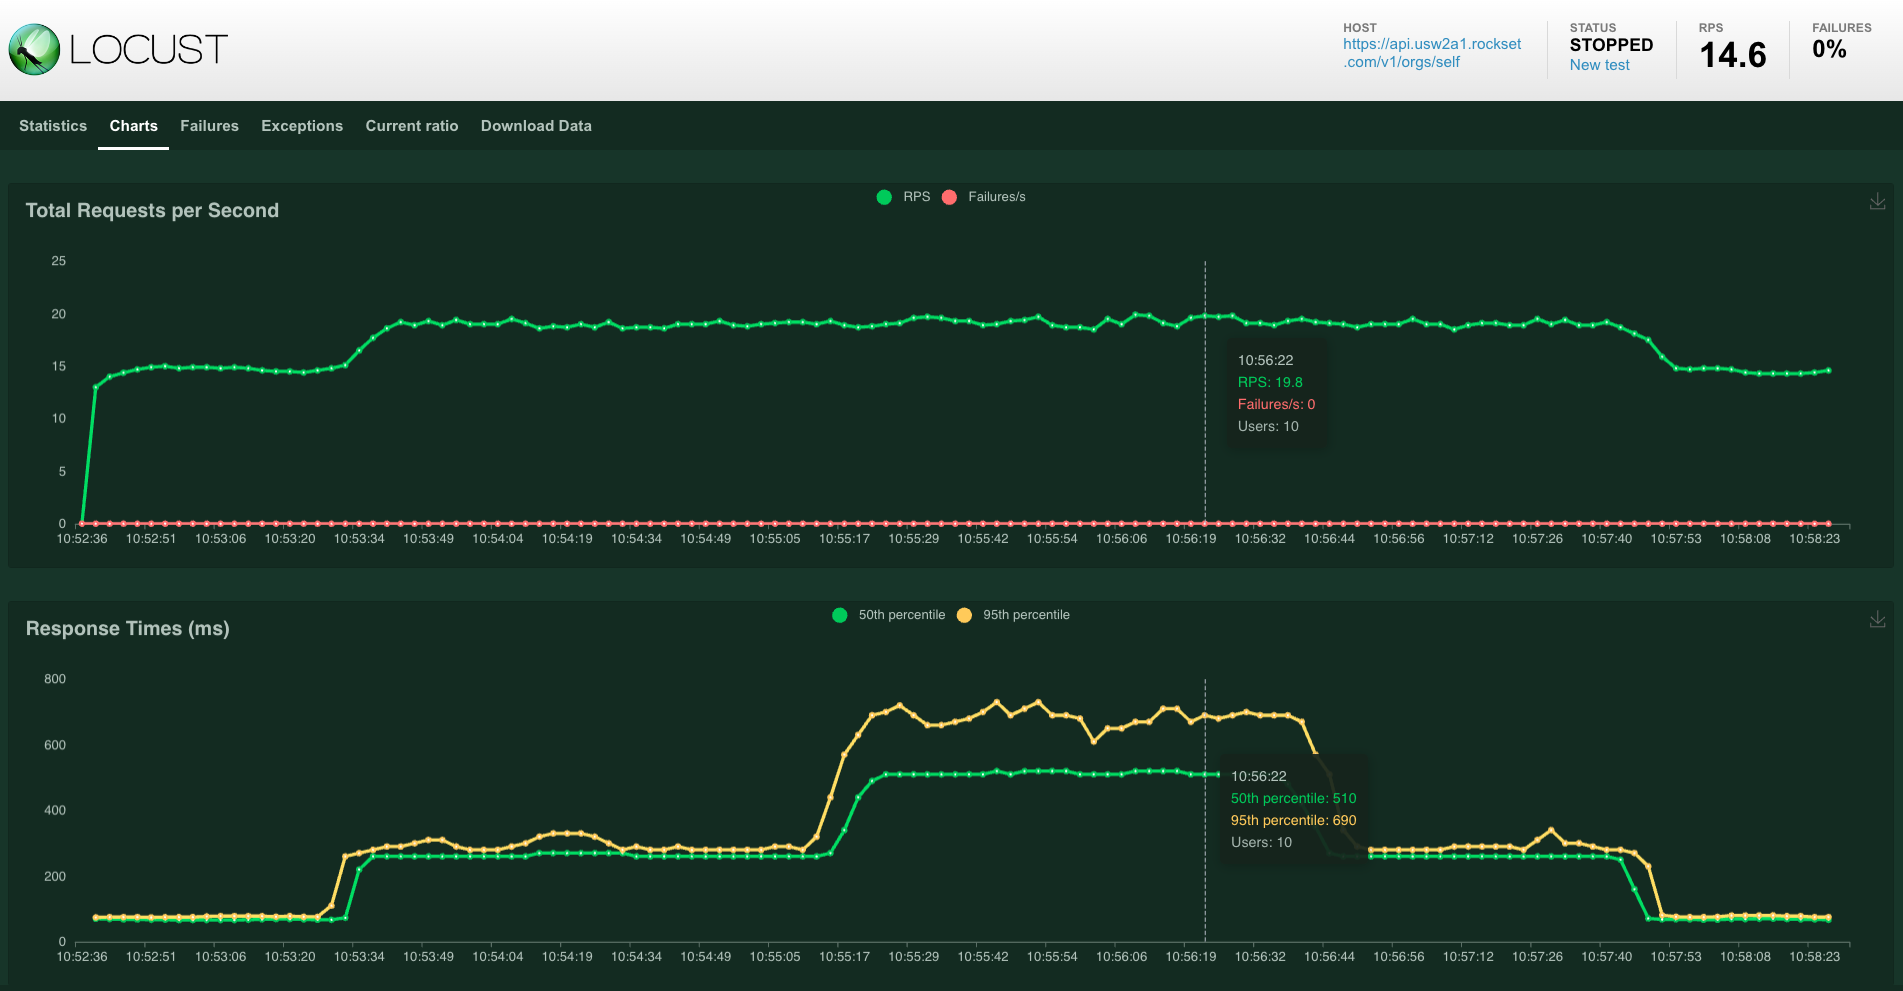
- Test scalability: Locust will continue to spawn users until it reaches the total number specified. It ensures the load is increased gradually as per the specified spawn rate, allowing you to observe how the system performance changes as the load increases. You can see this in the graph below where the number of users starts to grow to 5 and 10 and then go down again.
- User behavior simulation: Virtual users will wait for a random time between tasks, as defined by the
wait_timein the script. This simulates more realistic user behavior. We didn’t do this in our case but you can do this and more advanced things in Locust like custom load shapes, and so on. - Continuous test execution: The test will continue running until you decide to stop it, or until it reaches a predefined duration if you’ve set one.
- Resource utilization: During this process, Locust utilizes your machine’s resources to simulate the users and make requests. It’s important to note that the performance of the Locust test can also depend on the resources of the machine it’s running on.
Let’s now interpret the results we’re seeing.
Interpreting and validating load testing results
Interpreting results from a Locust run involves understanding key metrics and what they indicate about the performance of the system under test. Here are some of the main metrics provided by Locust and how to interpret them:
- Number of users: The total number of simulated users at any given point in the test. This helps you understand the load level on your system. You can correlate system performance with the number of users to determine at what point performance degrades.
- Requests per second (RPS): The number of requests (queries) made to your system per second. A higher RPS indicates a higher load. Compare this with response times and error rates to assess if the system can handle concurrency and high traffic smoothly.
- Response time: Usually displayed as average, median, and percentile (e.g., 90th and 99th percentile) response times. You will likely look at median and the 90/99 percentile as this gives you the experience for “most” users – only 10 or 1 percent will have worse experience.
- Failure rate: The percentage or number of requests that resulted in an error. A high failure rate indicates problems with the system under test. It’s crucial to analyze the nature of these errors.
Below you can see the total RPS and response times we achieved under different loads for our load test, going from a single user to 10 users and then down again.

Our RPS went up to about 20 while maintaining median query latency below 300 milliseconds and P99 of 700 milliseconds.

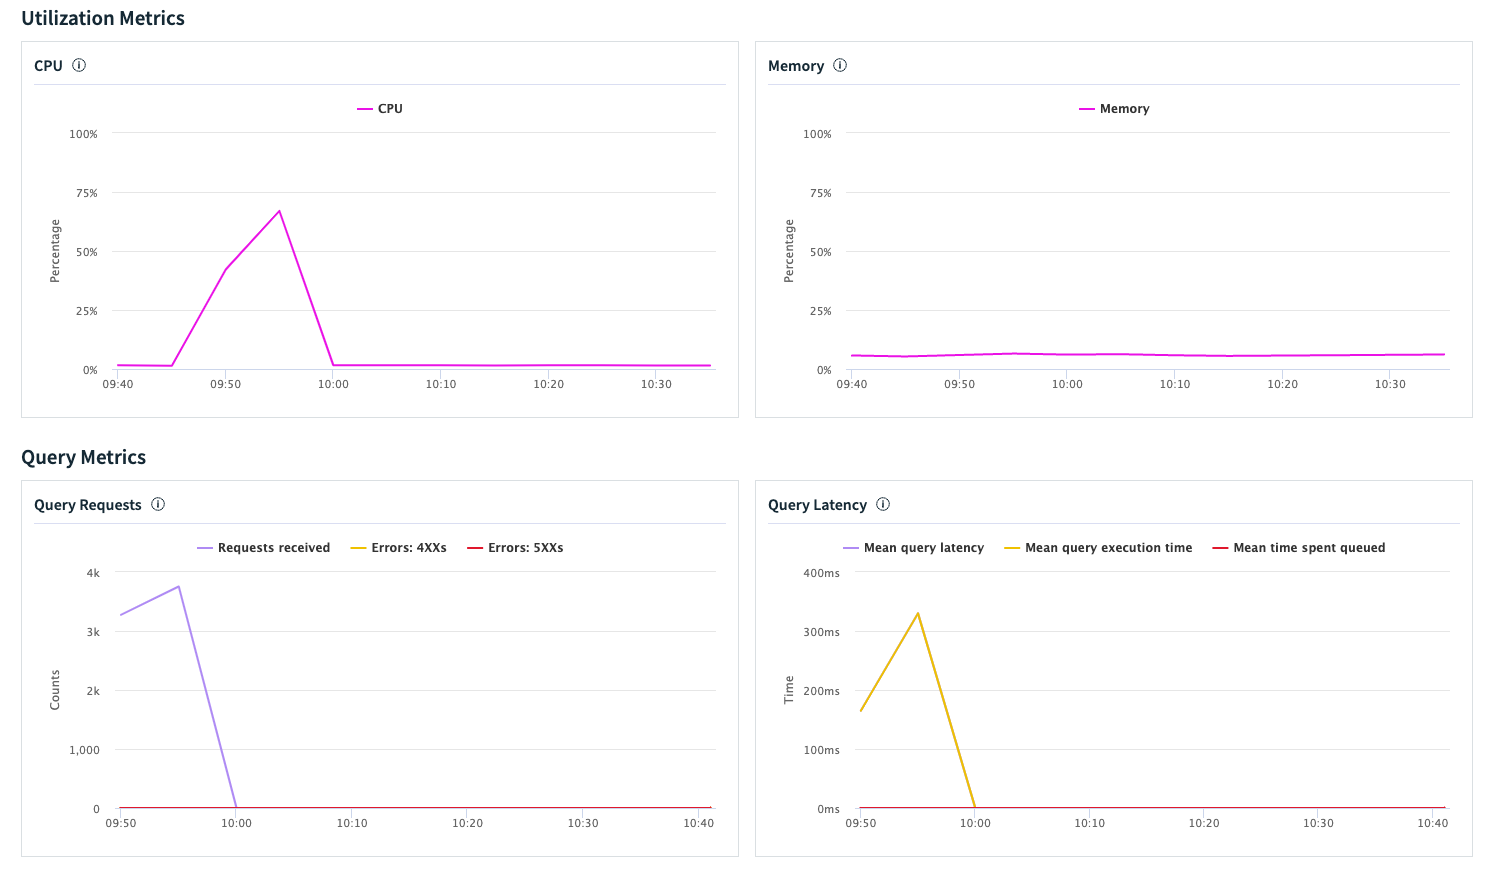
We can now correlate these data points with the available virtual instance metrics in Rockset. Below, you can see how the virtual instance handles the load in terms of CPU, memory and query latency. There is a correlation between number of users from Locust and the peaks we see on the VI utilization graphs. You can also see the query latency starting to rise and see the concurrency (requests or queries per second) go up. The CPU is below 75% on the peak and memory usage looks stable. We also don’t see any significant queueing happening in Rockset.

Apart from viewing these metrics in the Rockset console or through our metrics endpoint, you can also interpret and analyze the actual SQL queries that were running, what was their individual performance, queue time, and so on. To do this, we must first enable query logs and then we can do things like this to figure out our median run and queue times:
SELECT
    query_sql,
    COUNT(*) as count,
    ARRAY_SORT(ARRAY_AGG(runtime_ms)) [(COUNT(*) + 1) / 2] as median_runtime,
    ARRAY_SORT(ARRAY_AGG(queued_time_ms)) [(COUNT(*) + 1) / 2] as median_queue_time
FROM
    commons."QueryLogs"
WHERE
    vi_id = ''
    AND _event_time > TIMESTAMP '2023-11-24 09:40:00'
GROUP BY
    query_sql
We can repeat this load test on the main VI as well, to see how the system performs ingestion and runs queries under load. The process would be the same, we would just use a different VI identifier in our Locust script in Step 6.
Conclusion
In summary, load testing is an important part of ensuring the reliability and performance of any database solution, including Rockset. By selecting the right load testing tool and setting up Rockset appropriately for load testing, you can gain valuable insights into how your system will perform under various conditions.
Locust is easy enough to get started with quickly, but because Rockset has REST API support for executing queries and query lambdas, it’s easy to hook up any load testing tool.
Remember, the goal of load testing is not just to identify the maximum load your system can handle, but also to understand how it behaves under different stress levels and to ensure that it meets the required performance standards.
Quick load testing tips before we end the blog:
- Always load test your system before going to production
- Use query lambdas in Rockset to easily parametrize, version-control and expose your queries as REST endpoints
- Use compute-compute separation to perform load testing on a virtual instance dedicated for queries, as well as on your main (ingestion) VI
- Enable query logs in Rockset to keep statistics of executed queries
- Analyze the results you’re getting and compare them against your SLAs – if you need better performance, there are several strategies on how to tackle this, and we’ll go through these in a future blog.
Have fun testing 💪
Useful resources
Here are some useful resources for JMeter, Gatling and k6. The process is very similar to what we’re doing with Locust: you need to have an API key and authenticate against Rockset and then hit the query lambda REST endpoint for a particular virtual instance.


