Characterization of LMOFs
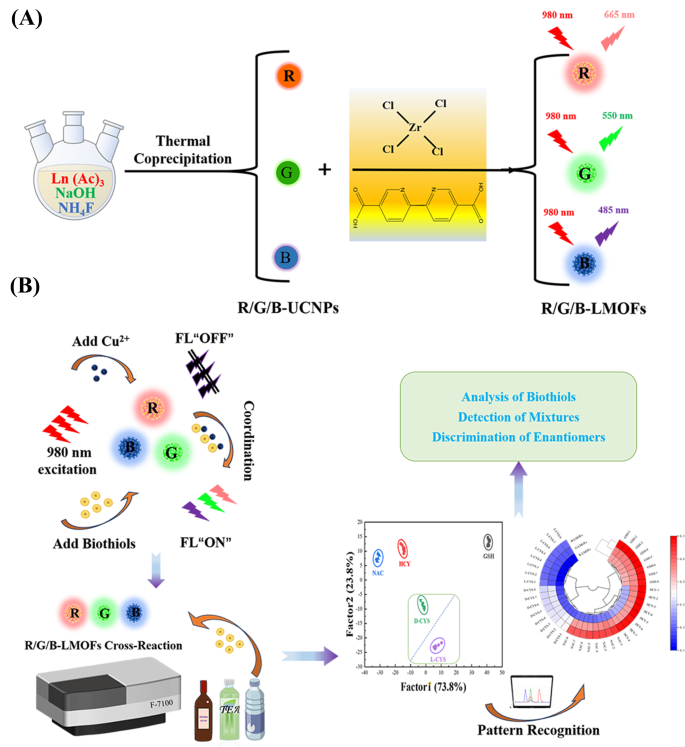
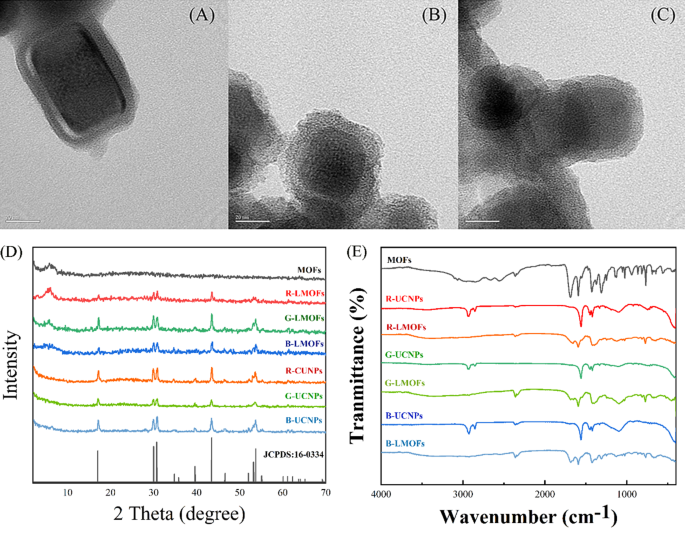
In order to realise the facile analysis for biothiols, a tricolor upconversion fluorescence sensor array based on R/G/B-LMOFs was further developed. The core − shell structure R/G/B-LMOFs materials were designed and synthesised by introducing MOFs cladding layer onto the surface of the corresponding R/G/B-UCNPs in a facile strategy, where zirconium (IV)-based UiO-type MOFs bridged by BPy-DCA ligands was in situ paved with R/G/B-UCNPs through self-assembly driven by electrostatic interaction (Scheme 1A). The obtained three LMOFs materials were further analysed to assess their elemental composition, morphology, XRD, FT-IR, UV-Vis, TGA and fluorescence characteristics. The corresponding main elemental composition in the resulting R-UCNPs (Y, Tm and Er), G-UCNPs (Y, Yb and Er), B-UCNPs (Y, Yb and Tm), R-LMOFs (Zr, Y, Tm and Er), G-LMOFs (Zr, Y, Yb and Er), and B-LMOFs (Zr, Y, Yb and Tm) were observed (Fig. S1), which showed that Zr (IV)-based MOFs were successfully assembled with the corresponding UCNPs, respectively. The SEM image of the resulting R/G/B-LMOFs exhibited a similar agglomerated granular structure with MOFs (Fig. S2), and the TEM morphology of R/G/B-LMOFs revealed the similar core − shell structure with average size about 40–50 nm, wherein the MOFs layer (about 7 nm thick) was assembled onto the hexagonal phase R/G/B-UCNPs (about 30–40 nm) (Fig. 1A and C and Fig. S3), which indicated that the core − shell structure R/G/B-LMOFs materials were successfully synthesized. The investigation of crystal structure revealed that the diffraction peaks of the resulting R/G/B-LMOFs integrated the characteristic peaks of pure MOFs and the corresponding R/G/B-UCNPs equipped with the pure hexagonal phase of NaYF4 (JCPDS no. 16–0334) (Fig. 1D). The corresponding functional group information of R/G/B-LMOFs in FT-IR spectroscopy showed that the visible characteristic stretching vibrations peaks of R/G/B-LMOFs were similar to the pure MOFs. The emerging characteristic peak (1659, 1668, and 1682 cm− 1) were associated with the C-N stretching frequency of pyridine groups on R/G/B-LMOFs compared with R/G/B-UCNPs (Fig. 1E), which indicated that the MOFs layer was covered onto the surface of UCNPs. Meanwhile, TGA revealed that all the three R/G/B-LMOFs have good thermal stability (Fig. S4).
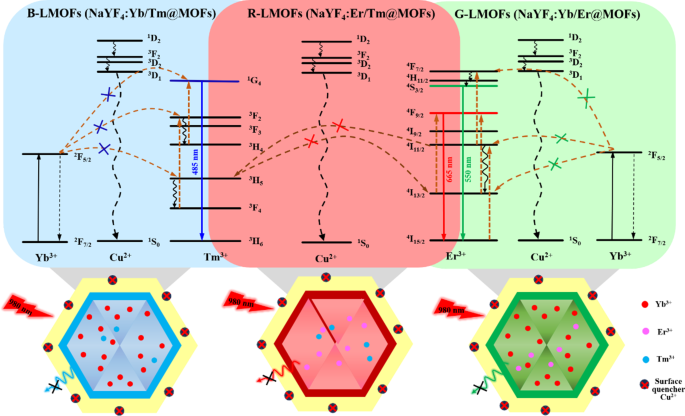
The fluorescence emission spectra of the obtained R/G/B-LMOFs materials were measured under an excitation wavelength of 980 nm (Fig. S5), which exhibited the characteristic spectra of the corresponding core R/G/B-UCNPs due to the photon energy level transition and energy transfer of the different doping elements in UCNPs, where the main red emission (665 nm) of R-UCNPs (NaYF4:Er/Tm) is corresponding to 4F9/2→4I15/2 transitions of Er3+ in the energy transfer between Er3+ and Tm3+, the main green emission (550 nm) of G-UCNPs (NaYF4:Yb/Er) is corresponding to 4S3/2→4I15/2 transitions of Er3+ in the energy transfer between Yb3+ and Er3+, and the main blue emission (485 nm) of B-UCNPs (NaYF4:Yb/Tm) is corresponding to 1G4→3H6 transitions of Tm3+ in the energy transfer between Yb3+ and Tm3+. Meanwhile, the fluorescence emission intensity of R/G/B-LMOFs were stronger than that of the corresponding core R/G/B-UCNPs, which could be resulted from that the inert MOF shell adjusted the lattice defects on the surface of the core UCNPs and/or the inert MOF shell served as a spacer matrix to isolate the quenching effect of solvent molecules [6]. The quantum yield and fluorescence lifetime investigation further showed the excellent optical properties of R/G/B-LMOFs (Table S1). These results demonstrated that the R/G/B-LMOFs-based sensors could provide excellent upconversion luminescence properties and abundant bipyridine functional sites in the fluorescence sensing.
Fluorescence response mechanism of LMOFs
Generally, the bipyridine groups can coordinate selectively with Cu2+, which could reinforce the interaction of LMOFs to Cu2+ than that of the core UCNPs to Cu2+. As expected, three R/G/B-LMOFs revealed more stronger fluorescence quenching to Cu2+ than that of the corresponding core R/G/B-UCNPs due to the introduction of MOFs with bipyridine groups to UCNPs (Fig. S6). The fluorescence response mechanism of LMOFs to Cu2+ was further explored. The appearance of a small blue shift in UV-Vis spectrum was resulting from the interaction between R/G/B-LMOFs and Cu2+, which preliminary implied the formation of cupric bipyridine coordinates (Fig. S7). The absorption band that resulted from the interaction of Cu2+ with MOFs are not overlapped with the fluorescence emission peaks of R/G/B-LMOFs, which can be inferred that the Cu2+-induced fluorescence quenching of R/G/B-LMOFs could be caused by the energy transfer rather than the inner-filter effect (Fig. S8). Inspired by previous studies, the possible energy transfer mechanism about the Cu2+-induced fluorescence quenching of R/G/B-LMOFs was shown in Fig. 2, wherein the energy transfer mechanism of Er3+, Tm3+, and Yb3+-assisted upconversion process in the NaYF4 under excitation of 980 nm could be disturbed by Cu2+. Due to the possible overlap between lanthanide metal ions-trimer luminescence peak with the absorption spectrum of cupric bipyridine coordinates, the present Cu2+ on the surface of LMOFs could disturb the energy transfer from Er3+ to Tm3+(R-LMOFs), Yb3+ to Er3+(G-LMOFs), and Yb3+ to Tm3+(B-LMOFs), and the corresponding energy transfer was transferred to the 1D2 level of Cu2+, forming the non-radiative transition from the de-excitation of Cu2+ to the ground state [28]. Such results supported the energy transfer mechanism in LMOFs-based sensing system for Cu2+. Meanwhile, R/G/B-LMOFs showed obvious fluorescence response to Cu2+ than that of other divalent metal ions and biomolecules (Fig. S9). After optimizing the sensing conditions (Fig. S10), the fluorescence intensity of all the three R/G/B-LMOFs gradually decreased with the increasing of Cu2+ (5.0 × 10⁻⁸-1.0 × 10− 6 M) and the plots of the fluorescence quenching degree ((F0-Fi)/F0) versus Cu2+ exhibited a good linear correlation, which also exhibited a certain of fluorescence response difference between the three R/G/B-LMOFs to Cu2+ (Fig. S11). Herein, we speculated that the fluorescence response of R/G/B-LMOFs to Cu2+ could be disturbed by some targets that can combine with Cu2+, and their fluorescence response difference could be enlarged to form the unique fluorescence fingerprint of the targets. Inspired by the easy coordination of Cu2+ with sulfhydryl groups, biothiols were introduced into the sensing platform of LMOFs and Cu2+ to verify the hypothesis. GSH was chosen as model biothiols to explore the fluorescence response mechanism in the sensing platform of R/G/B-LMOFs and Cu2+. All the three R/G/B-LMOFs exhibited obvious fluorescence quenching to Cu2+, while little fluorescence response to GSH. As expected, the introduced GSH can influence the fluorescence quenching of R/G/B-LMOFs triggered by Cu2+ due to the competitive binding between GSH with Cu2+ (Fig. 3). Under the optimal working conditions (Fig. S12), the fluorescence intensity of R/G/B-LMOFs increased with the increase of GSH content (5.0 × 10⁻⁵-1.0 × 10− 7 M) and the plot of fluorescence response ((Fi-F0)/F0) versus the logarithm of GSH concentration showed a good linear relationship (Fig. S13). The fluorescence response in the three R/G/B-LMOFs could be employed as the unique fingerprint of GSH, and the recognition fingerprint of other biothiols could be further obtained from the sensing platforms.
Pattern recognition of biothiols using R/G/B-LMOFs fluorescence sensor array
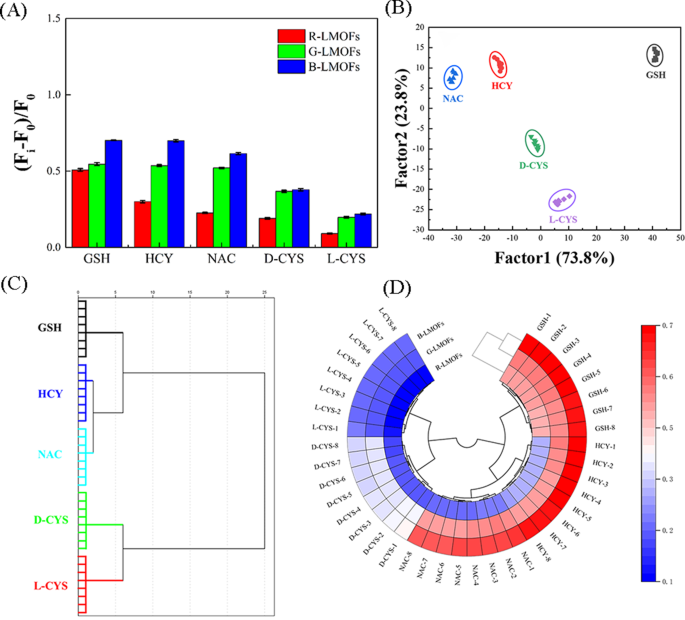
By virtue of the near-infrared feature and excellent responsiveness, three R/G/B-LMOFs were employed to construct a tricolor upconversion fluorescence sensor array for the pattern recognition of five biothiols (including GSH, HCY, NAC, and D/L-CYS) (Table S2), wherein each R/G/B-LMOFs could respond to biothiols and the characteristics of each biothiols could be reflected by the generated features fluorescence signal from the cross-reactive of R/G/B-LMOFs in a unique manner (Scheme 1B). Under the optimal working conditions, five biothiols were detected in the R/G/B-LMOFs fluorescence sensor array, three R/G/B-LMOFs showed significant fluorescence response ((Fi-F0)/F0) against five kinds of biothiols (100 µM), which was regular and closely related to biothiols (Fig. 4A). The obtained fluorescence signals were further trained in a matrix (R/G/B-LMOFs × 5 biothiols × 8 replicates) to maximize the separation ability as the “identification fingerprints” of biothiols by using LDA, which can be employed to classify, separate, and identify biothiols with the linear combination of features by converting the training matrix into canonical scores according to Mahalanobis distance. The generated three canonical factors (73.8%, 23.8% and 2.4%) for the total variance were plotted into the 2D figure, where each kind of biothiols was well-clustered without any overlap, discriminating thoroughly from each other (100% accuracy) (Fig. 4B). Meanwhile, the dendrogram of five biothiols were clustered independently according to the categories by HCA (Fig. 4C), and the difference among five biothiols in the three R/G/B-LMOFs channels also was displayed by the heat mapping (Fig. 4D), which revealed the good potential of the R/G/B-LMOFs fluorescence sensor array in distinguishing biothiols. Encouraged by such results, the R/G/B-LMOFs fluorescence sensor array was further employed to verify the recognition ability of five biothiols at a lower concentration (50 µM), and the results of LDA, HCA and heatmapping demonstrated a better pattern recognition with high accuracy towards the low concentration biothiols (Fig. S14 and S15), which displayed a higher sensitivity over the previous report (100 µM) [29, 30]. Delightedly, we found that the two chiral enantiomers biothiols (L-Cys and D-Cys) were independent of each other in the LDA, HCA and heatmapping, which was highlighting the capacity for chiral recognition.
(A) Signal patterns of the relative fluorescence variety ((Fi-F0)/F0) of the R/G/B-LMOFs fluorescence sensor array in the presence of five biothiols (100 µM). (B) Canonical score plot of 2D for the response patterns of biothiols obtained from LDA. Each point represents the response pattern for single biothiols species. (C) Dendrogram generated by HCA of five biothiols, and (D) Ring heat mapping of five biothiols
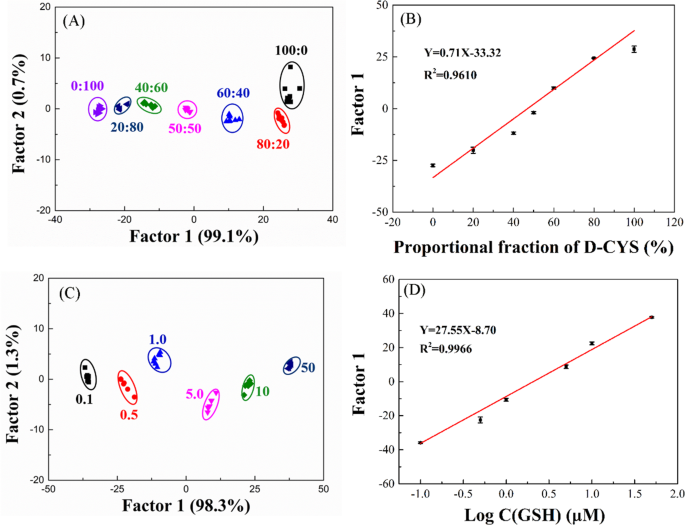
To further explore the performance of the R/G/B-LMOFs fluorescent sensor array, the different molar ratios of L-Cys and D-Cys mixtures can be fully distinguished by the R/G/B-LMOFs fluorescence sensor array and the obtained first discriminant Factor 1 values vary with the proportion of the two L/D-Cys (Fig. 5A and B), which was cost-effective and easy to use than that of the traditional chromatographic methods. Meanwhile, the different concentration of GSH can be separated in LDA score plot (Fig. 5C), and the first discriminant Factor 1 values were linearly related to the logarithm of the concentrations of GSH (Fig. 5D), and the similar analysis results can be found in the other biothiols (NAC, HCY, and L/D-CYS) (Fig. S16), which demonstrated the feasibility of the proposeded fluorescence sensor array in the quantitative analysis.
(A) Canonical score plot against the mixtures of L-CYS and D-CYS by LDA. (B) Variation curve of Factor 1 values and the mixture of L-CYS and D-CYS. (C) Canonical score plot against different concentrations of GSH by LDA. (D) The linear fitting curve representing relationship between the different concentrations of GSH and Factor 1 values
Identification of biothiols in real samples
The practical application of the proposed R/G/B-LMOFs fluorescence sensor array was further investigated in tea beverage and white wine samples. Standard addition method was employed by spiking known amounts of biothiols (100 µM) into samples extraction, and 30 unknown biothiols were spiked in tea drink and white wine samples respectively and randomly picked from the matrix (Table S3–S6). The blind tests exhibited 90.0% accuracy in biothiols discrimination and the results were reliable in tea drink with 93.3% accuracy, which is higher than that of white wine (86.7%) (Table 1), which indicated the good practical applications potential of the developed fluorescent sensor array for biothiols detection.


