


Sign up for daily news updates from CleanTechnica on email. Or follow us on Google News!
The transition to electric vehicles has certainly been filled with drama. Tesla and European sales both dropped in 2024, while the Chinese EV market saw a meteoric rise which triggered a fresh round of tariffs. This turbulence makes it difficult to look into the future. But a few short years ago, EV growth was more predictable; EV sales were growing exponentially, even if absolute volumes hadn’t taken over the world yet.
The transition to new technologies often follows so-called “s-curves,” and last year I thought it would be interesting to explore the idea by modeling EV growth, partly to see what would happen, but mostly as a way of offering some middle ground between predictions that seemed either overly pessimistic or overly rosy (such as Tesla’s goal to ship 20 million units a year by 2030). But already when I published the article there were signs of change ahead, or as I put it, “short term concerns which could turn into longer term trends.” Seems now like a gross understatement.
Recently, David Waterworth published a nice article on the future of EVs, which included some insightful thoughts about s-curves from a few of the commenters, so I thought I’d revisit s-curves and see how these models have changed over the last year. Before continuing, I want to stress that models can’t predict the future. There are many models to choose from, and if you use a different model, you’ll get a different answer. And, even if you use the “right” model, the data will never follow it perfectly. Nevertheless, models can offer insight by framing the current situation in the context of typical, longer term trends. “All models are wrong,” as George Box put it, “but some are useful.” Are s-curves still useful for EVs?
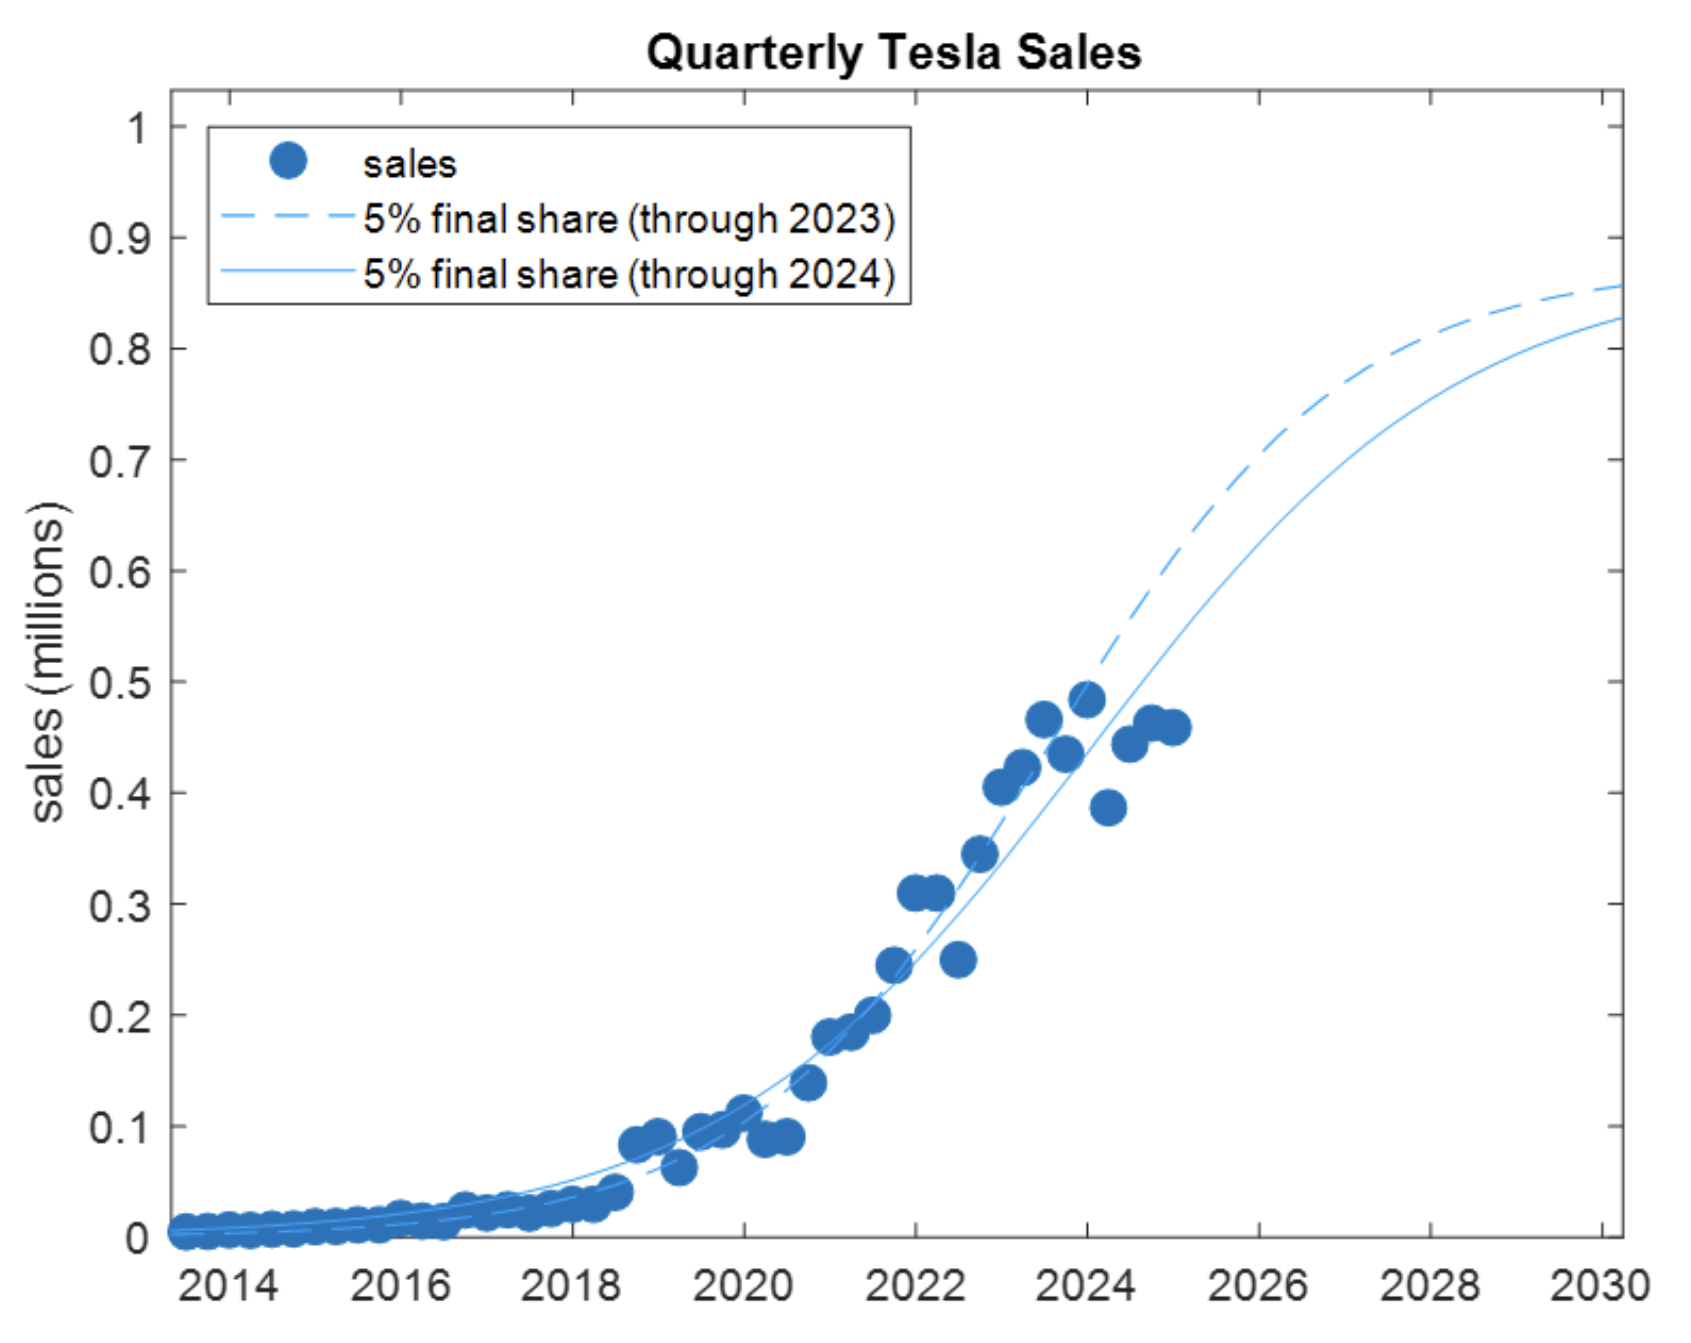
Last year we started with Tesla, so let’s do that again. As a reminder, to fit an s-curve, we need to first guess what Tesla’s final, global share of the automotive market will be, and here I’ll use 5 percent, since it’s a reasonable fit to the data. The plot shows Tesla’s quarterly sales along with last year’s s-curve fit (data through 2023) and this year’s fit (data through 2024). The 2024 data brought the trend down noticeably, but what’s more interesting is that last year’s data points don’t match either trend. In other words, the s-curve model has at least temporarily been broken.
Let’s now look at annual EV market share in China, Europe, and the US, using the same comparison.

We can see that China is still following last year’s s-curve with near precision, while last year’s data brought the European curve down and, like Tesla, the recent data have disconnected from the curves altogether. Meanwhile, the good-news bad-news from the US is that while sales are diverging from the curve, the overall performance isn’t that much worse than expected. (The silver lining of low expectations?)
To make “better” curves for Europe and the US, we could restrict the model fit to the most recent data, but the most recent data no longer matches an s-curve, so it’s not clear what model we should use. Or to put it another way, you tell me what projection you want, and I’ll provide a model to give it. The point here is that the path to the future in the West is much bumpier now, much less predictable.
That doesn’t mean that the world won’t transition to EVs. Most growth stories don’t follow a clean curve. As commenter “Jon’s Thoughts” rightly put it in David’s article, “Looking at those adoption curves for other technology products you will find that they generally are not smooth. They tend to be a bit jagged, indicating an occasional down year in an inexorable climb.”
Progress is rarely smooth (which makes China’s persistent performance all the more impressive). Here is a plot of adoption rates for various technologies in the US, as an example of this bumpiness:

So, things rarely go smoothly, but that doesn’t mean we won’t get there.
And yet, it can be discouraging in the short term, especially given the changing geo-political climate, at least in the US, which does affect the bottom line through dropped incentives, tariffs, delayed charging infrastructure, Tesla backlash, relaxed emission standards, as well the rejection of climate science, which reframes the entire conversation in false narratives.
There is another model that sometimes applies, called the Gartner Hype Cycle (sometimes confused with the Dunning-Kruger model). In this model, things go swimmingly at first, but headwinds soon emerge that threaten to bring progress to a halt.
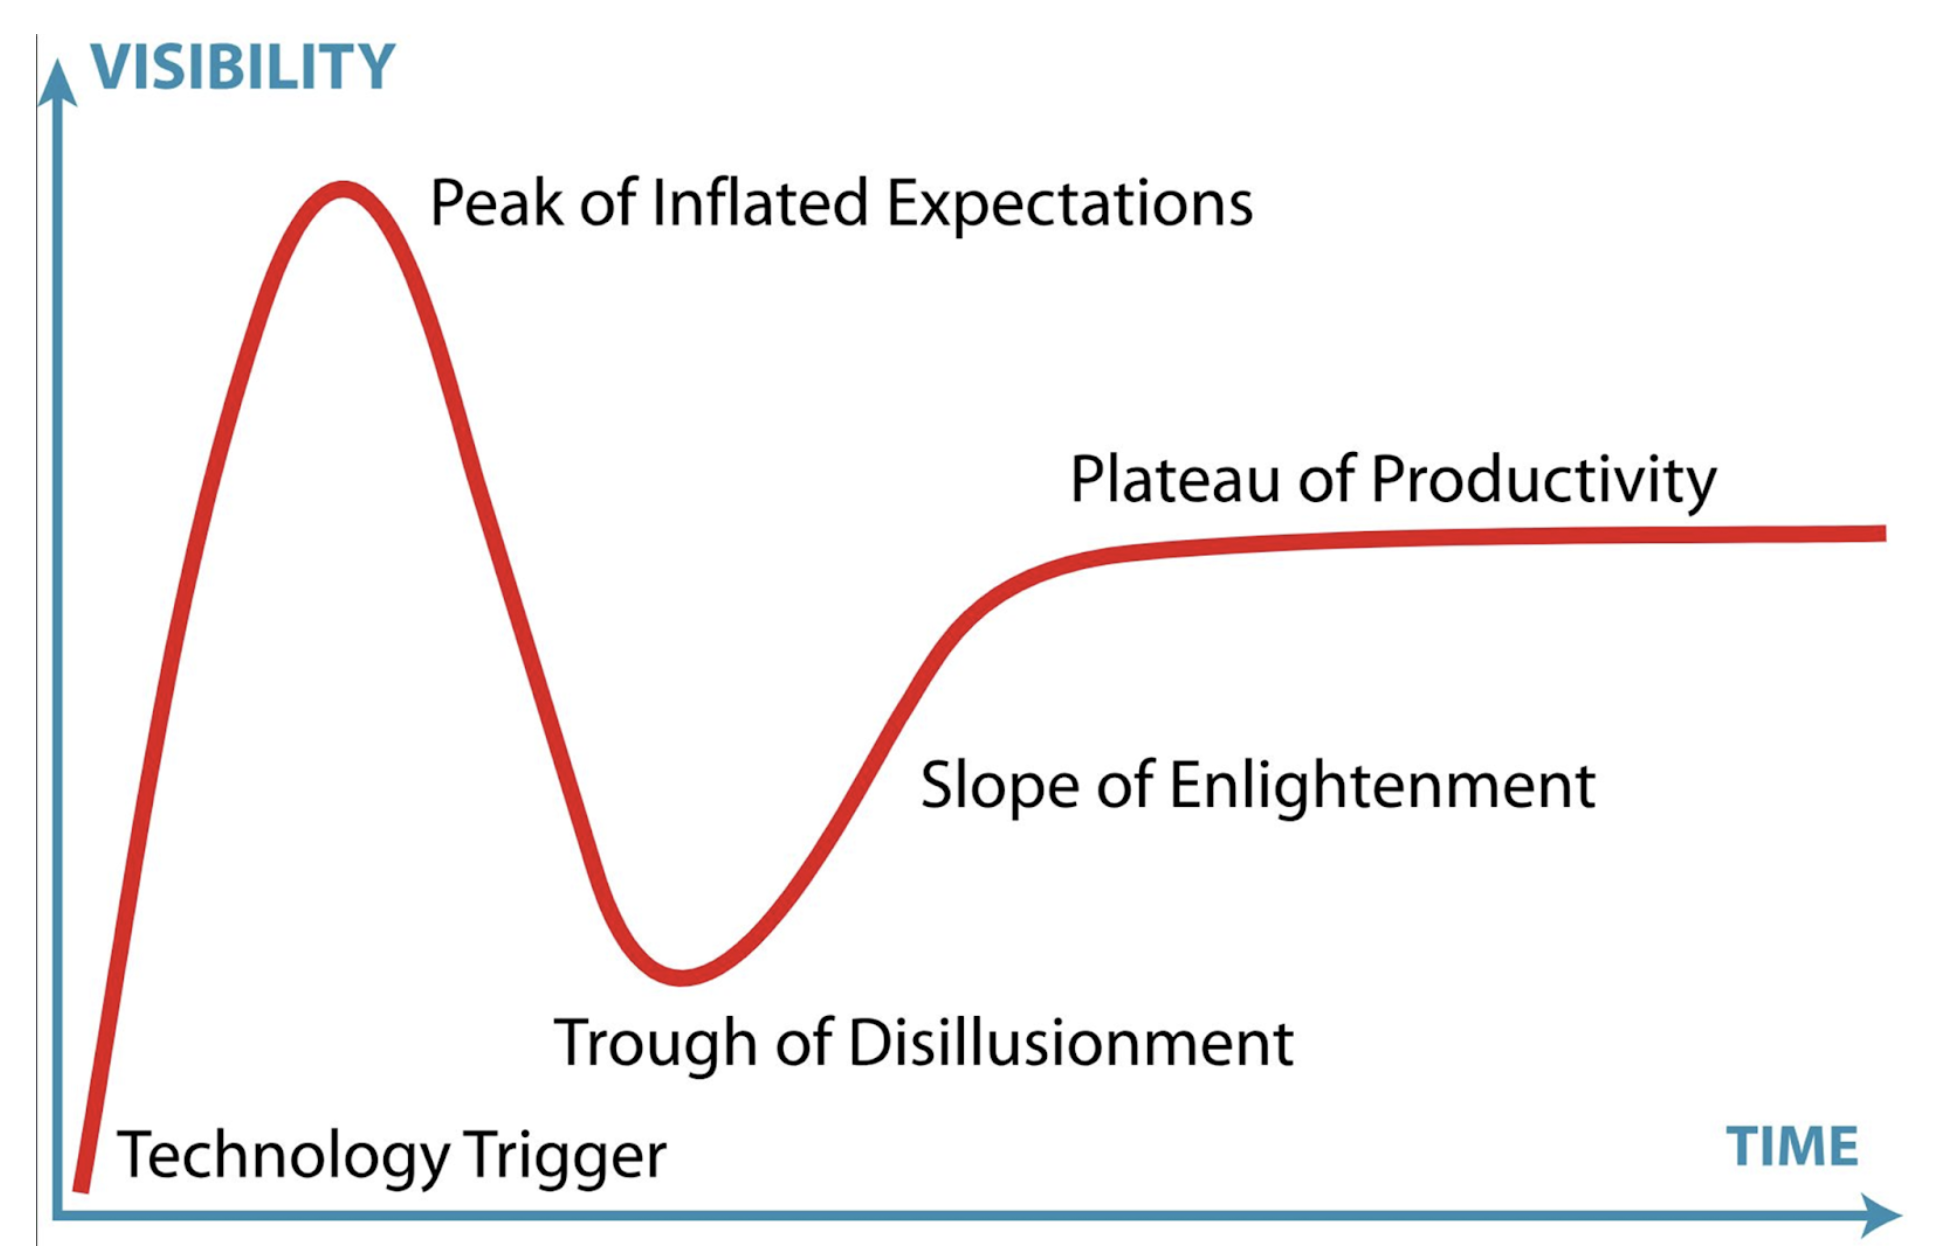
Early optimism can sometimes turn into a rough patch called the “Trough of Disillusionment,” or even the “Valley of Despair,” which seems especially fitting. Over the last few years, we’ve seen supply chain issues, inflation, sudden incentive drops, political uncertainty, as well as speculation that legacy manufacturers are purposefully dragging their feet. Headwinds have certainly accelerated.
However, this detour into the Valley of Despair is only a local phenomenon. Worldwide, EV sales continue to grow, led by Norway and powered by China. It seems to me that tariffs and feet-dragging will only postpone the inevitable. The West will isolate itself from competition until they can once again compete, or until the difference is too great to bear. Hopefully then, if not before, we’ll once again see the “inexorable climb.”
What are your thoughts on the transition to EVs? Will we return to exponential growth soon, or will it be a rough road ahead?
By David Gines, an electrical engineer specializing in algorithms for data analysis
Whether you have solar power or not, please complete our latest solar power survey.
Chip in a few dollars a month to help support independent cleantech coverage that helps to accelerate the cleantech revolution!
Have a tip for CleanTechnica? Want to advertise? Want to suggest a guest for our CleanTech Talk podcast? Contact us here.
Sign up for our daily newsletter for 15 new cleantech stories a day. Or sign up for our weekly one if daily is too frequent.
CleanTechnica uses affiliate links. See our policy here.
CleanTechnica’s Comment Policy
