The relationship between ligusticum chuanxiong and MIRI
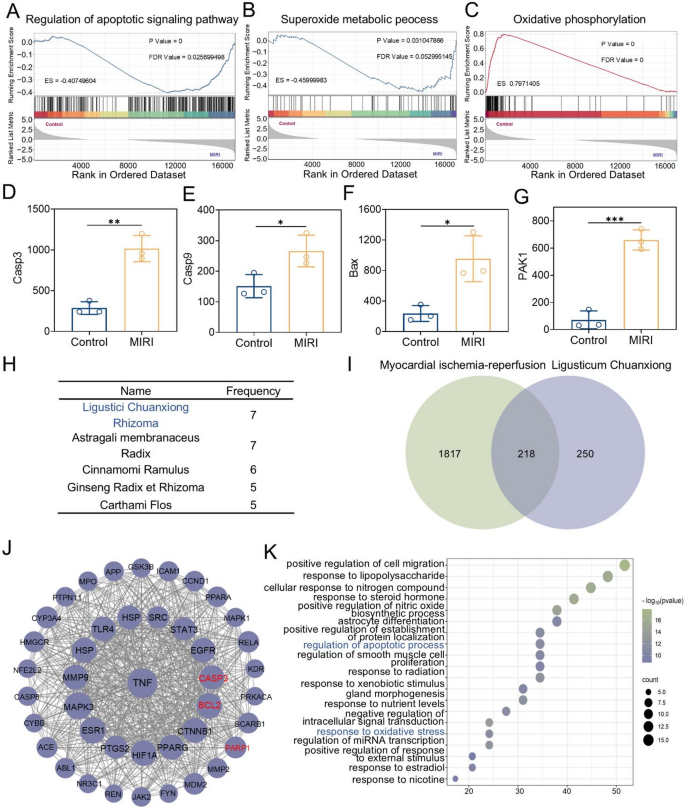
MIRI is one of the most severe complications following surgical operations for myocardial infarction in clinical practice [33]. An in-depth analysis of the relationship between MIRI and oxidative stress, as well as its specific pathogenesis, is crucial for enhancing clinical treatment and improving patient prognosis. To thoroughly explore the pathogenesis of MIRI, this study obtained high-throughput sequencing expression profile data from the Gene Expression Omnibus (GEO) and conducted research using the Gene Set Enrichment Analysis (GSEA) method. The gene expression datasets of the hearts from the control group and MIRI-modeled rats (GEO acc + ession number: GSE240847) were utilized in this study. GSEA results showed that DEGs were significantly enriched in apoptosis-related signaling pathways within the Gene Ontology (GO) gene set (Fig. 2A). Meanwhile, the research findings also demonstrated that the pathogenesis of MIRI is closely linked to multiple redox-related pathways (Fig. 2B, C, and Fig. S1). This study further examined several genes associated with apoptosis, specifically Caspase9, Caspase3, Bax, and PAK1, by analyzing their expression levels. The results indicated that these genes were upregulated in the MIRI rat model, confirming the activation of the apoptosis pathway. This finding establishes a strong correlation between MIRI and apoptosis (Fig. 2D-G).
Ligusticum Chuanxiong has a long history of use in treating heart diseases.8 In current clinical practice, it is often used as an adjuvant drug for the treatment of MIRI. However, the intrinsic relationship between Ligusticum Chuanxiong and MIRI remains unclear. This research explored the link between Ligusticum Chuanxiong and MIRI through drug screening and network pharmacology. Firstly, through drug screening, Ligusticum Chuanxiong was identified as a key traditional Chinese medicine for the treatment of MIRI. Using “myocardial ischemia-reperfusion” as the keyword, relevant Traditional Chinese medicine prescriptions were retrieved from the prescription database of Huabing Data (http://www.huabeing.com), and the drugs in the prescriptions were sorted and analyzed. The results showed that Ligusticum Chuanxiong and Astragali membranaceus were the drugs with the highest frequency of use (Fig. 2H). Subsequently, all the active ingredients of Ligusticum Chuanxiong were mined using the Traditional Chinese Medicine Systems Pharmacology Database and Analysis Platform (TCMSP, https://tcmsp-e.com/tcmsp.php). Given the numerous active ingredients of Ligusticum Chuanxiong, screening conditions were set based on pharmacokinetic parameters. Oral bioavailability (OB) ≥ 30% and drug-likeness (DL) ≥ 0.18 were set as the screening criteria. Finally, 10 active ingredients were selected as the research objects (Table S1). These 10 active ingredients were uploaded to the Swiss Target Prediction platform for target analysis, yielding 672 potential targets. At the same time, 2036 targets related to myocardial ischemia-reperfusion were obtained from the Gene Cards database. The overlap between Ligusticum Chuanxiong’s predicted targets and myocardial ischemia-reperfusion targets was analyzed, resulting in 218 shared targets (Fig. 2I). These 218 mapped targets were uploaded to the STRING database to generate the TSV file of the PPI network, subsequently analyzed using Cytoscape 3.10.1. In Cytoscape, targets with high dispersion were removed, and the “Network Analyzer” function was used to evaluate the topological characteristics of the results. The top 40 targets with the highest degree values were selected as key targets. Visualization was performed on the 40 key targets obtained by screening to construct and analyze the protein-protein interaction network (Fig. 2J). Finally, the 40 key targets were uploaded to the Metascape database for Gene Ontology (GO) pathway enrichment analysis. The findings revealed that Ligusticum Chuanxiong’s connection to MIRI is strongly linked to oxidative stress and apoptosis signaling pathways (Fig. 2K). In conclusion, we believe that Ligusticum Chuanxiong is a promising drug for reducing MIRI by targeting oxidative stress and apoptosis pathways.
The relationship between Ligusticum Chuanxiong and MIRI. (A–C) GSEA of differentially expressed genes between the Control group and MIRI rats (GEO accession no. 240847). (D–G) Comparison of the gene expression levels of the apoptosis signaling pathway among different groups (Casp3, Casp9, Bax, and PAK1). (H) The top five drugs in terms of frequency. (I) Venn diagram of the intersection of the targets of the active ingredients of Ligusticum Chuanxiong and disease-related targets. (J) Protein-protein interaction network of 40 key targets. (K) GO pathway enrichment analysis. Statistical comparisons were made using one-way ANOVA and t-test. Statistical significance was indicated as *p < 0.05, **p < 0.01, ***p < 0.001. Data are expressed as mean ± SD (n = 3)
Synthesis and characterization of LC-CDs
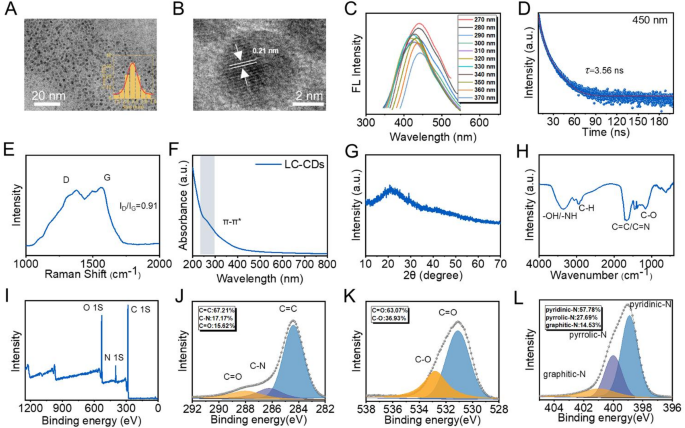
The difficulties in isolating the active constituents of Ligusticum Chuanxiong, coupled with its limited oral bioavailability and additional constraints, have impeded its application in clinical practice. To effectively address this issue, LC-CDs were successfully synthesized using a simple one-step hydrothermal method. The fresh Chinese herbal medicine Ligusticum chuanxiong was dried and ground into powder. Subsequently, LC-CDs were successfully obtained through a simple one-step hydrothermal synthesis method. During multiple synthesis processes, the yields of LC-CDs were relatively similar, approximately 10%. The transmission electron microscopy (TEM) image of LC-CDs is presented in Fig. 3A. The image demonstrates that LC-CDs possess excellent dispersibility and exhibit a morphology that is approximately quasi-spherical. The inset in Fig. 3A is the statistical result of the particle sizes of LC-CDs. This suggests that LC-CDs exhibit a narrow size distribution, with an average diameter of around 2.4 ± 0.03 nm (Fig. 3A). The extremely small particle size of LC-CDs indicates that it has a high specific surface area, which enables LC-CDs to expose more active sites and thus fully exert their functions. To further investigate the microscopic structural characteristics of LC-CDs, a high-resolution transmission electron microscope (HRTEM) was used to meticulously examine their lattice. After precise measurement, the lattice spacing of LC-CDs was found to be 0.21 nm, which corresponds to the (100) crystal plane of graphite, strongly demonstrating that LC-CDs possess a graphite-like phase structure (Fig. 3B). When CDs possess graphitized lattices with a spacing of 0.21 nm, their atomic arrangement exhibits a highly ordered π-π conjugate system. This structural feature provides an ideal condition for the formation of delocalized large π bonds. In the catalytic process, the presence of delocalized large π bonds significantly enhances the delocalization degree of the electron cloud, not only reducing the electron transfer resistance of the system but also effectively promoting the directional migration of electrons between the active sites and reactants, thus remarkably improving the electron transfer efficiency and overall performance of the catalytic reaction. The fluorescence property is one of the key properties of CDs. This research thoroughly investigated the fluorescence behavior of LC-CDs under varying excitation wavelengths. As shown in Fig. 3C under multiple excitation wavelengths, the optimal emission wavelengths of LC-CDs were predominantly concentrated around 450 nm. Further, by detecting the fluorescence decay curve of LC-CDs and through precise calculation, its fluorescence lifetime was obtained as 3.56 ns (Fig. 3D). In a dark environment, when LC-CDs were irradiated with ultraviolet light, it could be observed that they emitted blue-green fluorescence (Fig. S2). The above-mentioned phenomena fully indicate that the CDs derived from Ligusticum Chuanxiong have been successfully synthesized. Raman spectroscopy was used to accurately measure the degree of graphitization and surface defects in LC-CDs. In the Raman spectrum, the D peak around 1300 cm⁻¹ reflects the defect state of the carbon lattice, while the G peak near 1580 cm⁻¹ corresponds to the sp² hybridized carbon’s in-plane vibrational mode, indicating the graphitization level of LC-CDs. Raman spectroscopy revealed the coexistence of D and G peaks in the LC-CDs spectrum, with an ID/IG ratio of 0.91 (Fig. 3E). This result indicates that LC-CDs not only have a relatively high graphitization degree but also have a large number of defect sites on their surface. These surface defects and the π-π planar structure conducive to rapid electron transfer are highly likely to endow LC-CDs with remarkable catalytic properties. The ultraviolet absorption spectroscopy analysis results showed that LC-CDs exhibited a relatively broad absorption band in the wavelength range of 200–600 nm (Fig. 3F). This phenomenon is mainly attributed to the π-π* transition and n-π* transition existing in the carbon-dot structure. Among them, the π-π* transition originates from the presence of the sp²-hybridized structure in the carbon core. Under ultraviolet light irradiation, π-bonded electrons are excited from the π orbital to the π* orbital [34]. The n-π transition arises from surface functional groups like -NH₂, -OH, and -COOH, enabling non-bonding electrons to transition to the π orbital upon photon absorption. These functional groups also provide a material basis for LC-CDs to exert their functions. The X-ray diffraction (XRD) experiment further characterized the crystal structure of LC-CDs. The XRD pattern showed that LC-CDs have a relatively broad diffraction peak at 21.4°, which could be attributed to the (002) plane of graphite. Through calculation, the d-spacing corresponding to this diffraction peak was approximately 0.42 nm (Fig. 3G). Subsequently, Fourier-transform infrared spectroscopy (FT-IR) and X-ray photoelectron spectroscopy (XPS) were used to further and meticulously characterize the surface structure of LC-CDs. In the FT-IR spectrum, the broad absorption peak at 3375 cm⁻¹ could be attributed to the stretching vibration of-OH/-NH; the absorption peak at 2950 cm⁻¹ originated from the symmetric and asymmetric stretching vibrations of methyl and methylene groups (C-H) in saturated hydrocarbons; the absorption peak at 1661 cm⁻¹ corresponded to the absorption peak of the C = C double bond in the conjugated system or the stretching vibration of the C = N bond; the absorption peak at 1180 cm⁻¹ was caused by the stretching vibration of the C-O bond (Fig. 3H). These peaks confirm that LC-CDs possess abundant surface functional groups. The XPS analysis showed that LC-CDs are mainly composed of three elements: C, N, and O. Among them, the C1s peak had the highest intensity, with a corresponding content of 73.01%; the contents of O1s and N1s are 19.87% and 7.12%, respectively (Fig. 3I). Further, the XPS spectrum was subjected to peak-fitting processing for different elements. In the C1s spectrum, the peak at 248.4 eV corresponded to the C = C bond, the peak at 286.3 eV corresponded to the C-N bond, and the peak at 287.9 eV corresponded to the C = O; in the O1s spectrum, the peak at 531.1 eV corresponded to the C = O, and the peak at 532.8 eV corresponded to the C-O; in the N1s spectrum, the peaks at 398.9 eV, 400.07 eV, and 400.93 eV represented pyridinic-N, pyrrolic-N, and graphitic-N respectively. The detailed analysis results showed that in the C1s spectrum, the content of C = C was the highest, reaching 67.21%, and the contents of C-N and C = O were 17.17% and 15.62% respectively; in the O1s spectrum, the contents of C = O and C-O were 63.07% and 36.93% respectively; in the N1s spectrum, the contents of pyridinic-N, pyrrolic-N, and graphitic-N were 57.78%, 27.69%, and 14.53% respectively (Fig. 3J-L). The characterization results of XPS conclusively confirm that the chemical groups contained in Ligusticum chuanxiong are retained on the surface of LC-CDs. These groups constitute the material basis for LC-CDs to exert their pharmacological activities, providing crucial structural support for the realization of their biological functions. In conclusion, our thorough and systematic structural characterization of LC-CDs has confirmed their successful synthesis. The abundance of surface functional groups on LC-CDs enables potential pharmacological and catalytic functionalities. This finding greatly motivates us to further explore the potential applications of LC-CDs in relevant fields.
Synthesis and characterization of LC-CDs. (A) TEM and size distribution histogram of LC-CDs. (B) HR-TEM of Ca-CDs. (C) Emission spectra of LC-CDs under different excitations. (D) Fluorescence lifetime of LC-CDs. (E) Raman spectrum and (F) UV-vis spectrum of LC-CDs. (G) XRD spectrum and (H) FT-IR spectrum of LC-CDs. (I) XPS survey spectra of LC-CDs. (J–L) High-resolution XPS spectra of C 1s, O 1s, and N 1s for LC-CDs
Free radical scavenging evaluation of LC-CDs
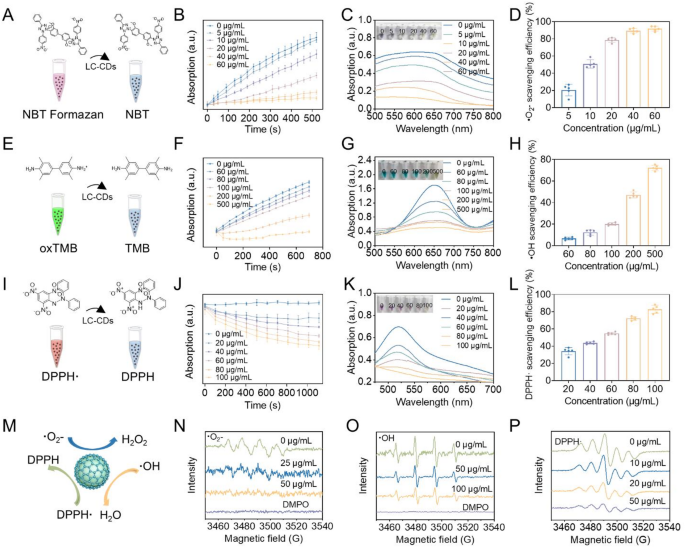
Within the carbon core structure, carbon atoms are arranged in a closely packed manner [35]. This highly ordered arrangement pattern can significantly reduce the energy gap width between carbon atoms [36]. According to the band theory, the reduction of the energy gap width implies a decrease in the energy required for electron transition [36]. Valence band electrons can be readily promoted through the absorption of modest energy inputs to traverse the forbidden energy gap and populate the conduction band. This electronic transition mechanism facilitates a marked increase in charge carrier density, as the delocalized electrons in the conduction band exhibit substantially enhanced mobility. The resultant elevation in free carrier population directly correlates with improved charge transport characteristics, thereby significantly enhancing the carbon-core material’s conductivity performance. The excellent electron-transfer properties of CDs can endow them with good catalytic activity. The research by Gao et al. has demonstrated that CDs derived from activated carbon possess ultra-high SOD activity [26]. Through surface-group capping experiments and numerous studies, it has been shown that the SOD activity of CDs stems from the combination of hydroxyl and carboxyl groups with superoxide anions, as well as the electron transfer carried out by carbonyl groups conjugated with the π-system. In our previous research, we also verified that CDs derived from Honeysuckle (Hy-CDs) exhibit strong SOD activity. In that research, we verified that the SOD activity of Hy-CDs is chiefly derived from a substantial quantity of amino groups on their surface. Building on this foundation, we systematically investigated the catalytic properties of LC-CDs. First, we examined the ability of LC-CDs to scavenge ·O₂⁻. A generation system of ·O₂⁻ was constructed using riboflavin and methionine. Upon light exposure, riboflavin absorbs photon energy, undergoes excitation, and donates electrons to methionine, self-oxidizing to generate a semiquinone radical. The semiquinone radical reacts with molecular oxygen to generate ·O₂⁻. The ·O₂⁻ generated in the system oxidizes nitroblue tetrazolium chloride (NBT) to blue-violet NBT formazan, which has a strong absorption at 560 nm (Fig. 4A). This system can be used to detect the scavenging effect of LC-CDs on ·O₂⁻. We first tested the kinetics of LC-CDs in scavenging ·O₂⁻ using this system. The UV absorption of solutions containing different concentrations of LC-CDs at 560 nm was continuously monitored within 520s. The results showed that as time elapsed, the absorption of the system solution without LC-CDs at 560 nm gradually increased, indicating that a large amount of ·O₂⁻ was generated in the solution. However, after adding LC-CDs, the UV absorption of the solution decreased significantly, suggesting that LC-CDs can remarkably inhibit the generation of ·O₂⁻ (Fig. 4B). Especially as the concentration of LC-CDs attained 60 µg/mL, the absorption of the solution at 560 nm hardly changed. Subsequent UV-Vis spectral analysis (500–800 nm) of the post-reaction solution revealed absorption characteristics that closely mirrored the time-dependent kinetic behavior observed in the chemical reaction (Fig. 4C). The final statistical results showed that as the concentration of LC-CDs increased, their ability to scavenge ·O₂⁻ gradually enhanced. As the concentration of LC-CDs attained 60 µg/mL, the scavenging rate of ·O₂⁻ nearly reached 100% (Fig. 4D). These results indicate that LC-CDs possess strong SOD-like enzyme activity. Immediately after, we examined the ability of LC-CDs to scavenge hydroxyl radicals (·OH). ·OH is a key element causing and aggravating the physiological imbalance in the human body. We simulated the generation of ·OH using the Fenton reaction between Fe²⁺ and H₂O₂. In this system, 3,3’,5,5’-tetramethylbenzidine (TMB) was used as a chromogenic substance (Fig. 4E). After being oxidized to oxTMB, the solution turns green and can be detected at 652 nm by a microplate reader. Consistent kinetic detection outcomes indicated that with the progressive increase in the concentration of LC-CDs, the oxidation rate of TMB in the solution exhibited a gradual deceleration. This finding corroborated the fact that LC-CDs possess a definite capacity for scavenging·OH (Fig. 4F). Further, we detected the UV absorption spectrum of reaction systems with different LC-CDs concentrations in the range of 500–800 nm. The data revealed that when the concentration of LC-CDs reached 500 µg/mL, TMB was hardly oxidized (Fig. 4G). The statistical results showed that high-concentration LC-CDs can achieve a scavenging rate of nearly 80% for ·OH (Fig. 4H).
Thereafter, we evaluated the scavenging effect of LC-CDs on nitrogen-containing radicals. 1,1-Diphenyl-2-picrylhydrazyl radical (DPPH·) is a typical nitrogen-containing radical. The lone-pair electrons of DPPH· have strong absorption in the visible light region (515–520 nm), making the solution purple (Fig. 4I). The kinetic results showed that the scavenging effect of LC-CDs on DPPH· is concentration-dependent. As time increased, LC-CDs at different concentrations all demonstrated scavenging efficiency for DPPH· (Fig. 4J). The UV absorption spectrum results showed that as the concentration of LC-CDs reached 100 µg/mL, the solution almost faded, indicating that DPPH· in the solution had been completely scavenged (Fig. 4K). The statistical results also confirmed that as the concentration of LC-CDs reached 100 µg/mL, the scavenging rate for DPPH· could reach approximately 80% (Fig. 4L). Next, we used electron paramagnetic resonance (EPR) technology to further detect the scavenging effect of LC-CDs on ·O₂⁻, ·OH, and DPPH· (Fig. 4N-P). The qualitative results indicated that LC-CDs have a good scavenging effect on these three radicals, and it is concentration-dependent. All the above-mentioned results suggest that LC-CDs possess strong antioxidant capacity (Fig. 4M). Given the typical pathological feature of ROS burst during myocardial ischemia-reperfusion, the antioxidant properties of LC-CDs are expected to show potential application value in the prophylaxis and management strategies for this disease.
Free radical scavenging evaluation of LC-CDs. (A) Schematic diagram of superoxide radical scavenging system. (B) Kinetic curves of ·O₂⁻ scavenged by LC-CDs. (C) UV absorption spectra of ·O₂⁻ scavenged by LC-CDs. (D) The scavenging rate of ·O₂⁻ by LC-CDs. (E) Schematic diagram of ·OH scavenging system. (F) Kinetic curves of ·OH scavenged by LC-CDs. (G) UV absorption spectra of ·OH scavenged by LC-CDs. (H) The scavenging rate of ·OH by LC-CDs. (I) Schematic diagram of DPPH· scavenging system. (J) Kinetic curves of DPPH· scavenged by LC-CDs. (K) UV absorption spectra of DPPH· scavenged by LC-CDs. (L) The scavenging rate of DPPH· by LC-CDs. (M) Schematic diagram of the scavenging of three types of free radicals by LC-CDs. (N–P) EPR Spectra Detect the Scavenging of ·O₂⁻, ·OH, and DPPH· by LC-CDs. Data are expressed as mean ± SD (n = 3)
Sub-organelle co-localization and antioxidant properties of LC-CDs in cells
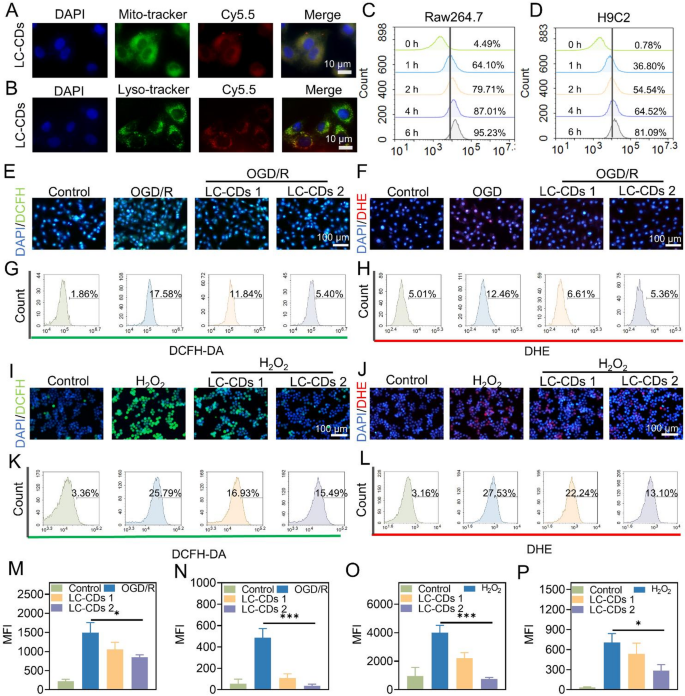
Upon myocardial ischemia-reperfusion, the restoration of nutrient and oxygen supply, however, exacerbates the generation of ROS [37]. The instantaneous burst of ROS disrupts the redox homeostasis in the local cardiac region, thereby causing damage to myocardial cells and further inducing inflammatory responses [38]. In this process, the interaction between inflammation and ROS jointly aggravates the MIRI. To thoroughly investigate the repair efficacy of LC-CDs on MIRI, this study systematically examined the antioxidant and anti-inflammatory capacities of LC-CDs at the cellular level. Firstly, the commonly used immune cell model, Raw264.7 cells, was selected to explore the localization of LC-CDs within subcellular organelles. The burst of ROS usually originates from mitochondria. In the mitochondrial respiratory chain, when electrons fail to transfer smoothly to coenzyme Q, they will leak out and directly react with molecular oxygen, generating a large amount of ·O₂⁻, ultimately leading to redox imbalance [39]. Because of this, this study first evaluated the colocalization of LC-CDs with mitochondria. In order to achieve direct visualization of liquid-phase LC-CDs using fluorescence microscopy, this study employed a chemical modification method to attach the fluorescent dye Cy5.5-amino to the surface of LC-CDs. After incubation treatment, the fluorescence emitted by mitochondria and LC-CDs could be clearly observed under a confocal laser scanning microscope. Through the image merging operation, a large number of overlapping regions between them were presented (Fig. 5A). Fluorescence colocalization analysis showed that the Pearson correlation coefficient of colocalization between mitochondria and LC-CDs was as high as 0.98 (Fig. S3A, B). This result fully confirms that LC-CDs are highly localized in mitochondria, and this localization characteristic facilitates their efficient scavenging of ROS. Subsequently, we evaluated the colocalization of LC-CDs with lysosomes. The results indicated that LC-CDs exhibited a certain degree of colocalization with lysosomes, but compared with mitochondria, the colocalization effect was relatively weaker (Fig. 5B). Through analysis, the colocalization coefficient of LC-CDs with lysosomes was 0.79 (Fig. S3C, D). The above results suggest that LC-CDs are more likely to localize in mitochondria and relatively easy to escape from lysosomes. Subsequently, this study employed flow cytometry to evaluate the uptake of LC-CDs by Raw264.7 and H9C2 cells. It was found that after 1-hour incubation, the uptake rate of LC-CDs by Raw264.7 cells could reach 64.10%, and that by H9C2 cells could reach 36.80% (Fig. 5C, D). As the incubation time prolonged, the uptake of LC-CDs by both cell types increased significantly. Next, an OGD/R model was constructed at the cellular level in this study to simulate the oxidative stress induced by ischemia-reperfusion. The 2’,7’-dichlorodihydrofluorescein (DCFH) probe was utilized to monitor the intracellular ROS level. When the intracellular oxygen pressure increased, DCFH was oxidized to DCF, which emits strong green fluorescence. The results showed that oxidative stress was successfully induced in H9C2 cells under OGD/R treatment. However, after treatment with LC-CDs, the fluorescence intensity of DCF was significantly weakened (Fig. 5E). Meanwhile, dihydroethidium (DHE) was applied to specifically assess the concentration of ·O₂⁻ in cells, and the results demonstrated that LC-CDs could also significantly scavenge ·O₂⁻ induced by OGD/R (Fig. 5F). The flow cytometry results strongly confirmed that LC-CDs possess remarkable antioxidant ability in the OGD/R model (Fig. 5G, H). Furthermore, this study used H₂O₂ to induce Raw264.7 cells to construct a secondary oxidative stress cell model. Similarly, DCFH and DHE were used to detect the levels of ROS and ·O₂⁻ in Raw264.7 cells. The findings demonstrated that in treatment with LC-CDs, the levels of ROS and ·O₂⁻ in Raw264.7 cells decreased significantly (Fig. 5I, J). The results from flow cytometry further quantified the ability of LC-CDs to scavenge ROS within cells. The flow cytometry results showed that LC-CDs could even reduce the level of ·O₂⁻ to that of the control group (Fig. 5K, L). Similarly, the results obtained from fluorescence statistics of fluorescent images also support the above conclusion (Fig. 5M-P). The above series of results fully confirm that LC-CDs also possess strong antioxidant ability at the cellular level.
Sub-organelle co-localization and antioxidant properties of LC-CDs in cells. (A) Fluorescence colocalization of LC-CDs with mitochondria. (B) Fluorescence colocalization of LC-CDs with lysosomes. (C and D) Flow cytometric analysis of the uptake of LC-CDs by Raw264.7 cells and H9C2 cells at different times. (E and F) Fluorescence images of different groups of H9C2 cells incubated with DCFH and DHE. (G and H) Flow analysis results of different groups of H9C2 cells incubated with DCFH and DHE. (I and J) Fluorescence images of different groups of Raw264.7 cells incubated with DCFH and DHE. (K and L) Flow analysis results of different groups of Raw264.7 cells incubated with DCFH and DHE. (M and N) MFI statistics after incubation of DCFH and DHE with H9C2 cells in different groups. (O and P) MFI statistics after incubation of DCFH and DHE with Raw264.7 cells in different groups. LC-CDs 1: inducer + 5 µg/mL LCCDs; LC-CDs 2: inducer + 10 µg/mL LC-CDs. Statistical comparisons were made using one-way ANOVA and a t-test. Statistical significance was indicated as *p < 0.05, **p < 0.01, ***p < 0.001. Data are expressed as mean ± SD (n = 3)
Cytoprotective effect of LC-CDs
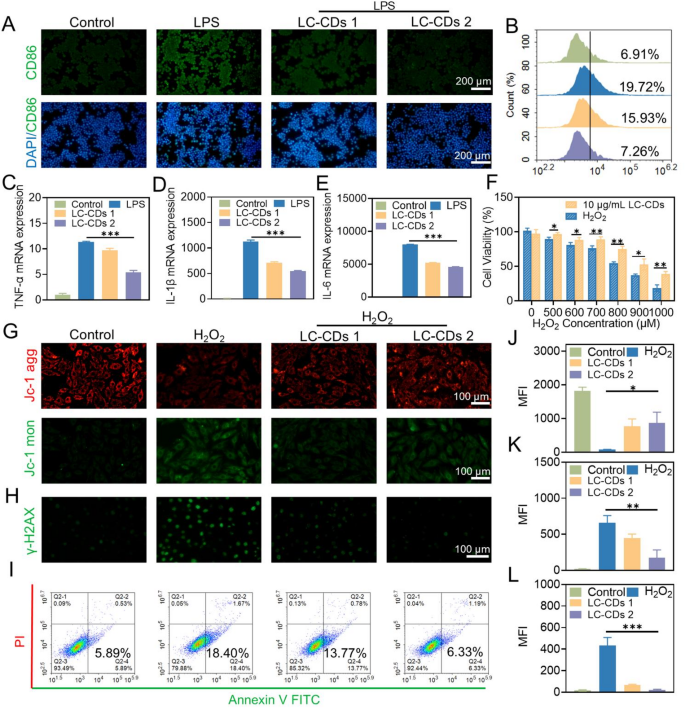
Multiple studies have demonstrated that macrophages are prone to polarize into M1-type macrophages under the stimulation of ROS. M1-type macrophages secrete a large amount of pro-inflammatory cytokines, which exacerbate the degree of damage following myocardial ischemia-reperfusion [40,41,42]. In this study, lipopolysaccharide (LPS) was employed to induce Raw264.7 cells to construct an M1-type macrophage model, and the cell-surface marker CD86 was selected to identify M1-type macrophages. The results of immunofluorescence detection showed that after treatment with LPS, LC-CDs at different concentrations could significantly inhibit the over-expression of CD86 on the surface of macrophages, and this result was also confirmed by flow cytometry experiments (Fig. 6A, B). Moreover, the large number of inflammatory cytokines secreted by M1-type macrophages aggravates the pathological process of myocardial ischemia-reperfusion. Based on this, this study evaluated the effect of LC-CDs on the release of pro-inflammatory cytokines (such as TNF-α, IL-1β, and IL-6) by Raw264.7 cells at the gene-expression level. The results of real-time fluorescence qPCR indicated that, under the stimulation of LPS, the expression of TNF-α, IL-1β, and IL-6 in Raw264.7 cells was significantly upregulated; while subsequent treatment with varying concentrations of LC-CDs resulted in a dose-dependent suppression of these inflammatory markers (Fig. 6C-E). This fully demonstrates that LC-CDs can significantly inhibit the occurrence of the immune response of Raw264.7 cells under stimulated conditions. The oxidative damage caused by myocardial ischemia-reperfusion is usually irreversible. Given that the antioxidant and anti-inflammatory effects of LC-CDs have been evaluated previously, it is hypothesized that LC-CDs possess a certain ability to resist oxidative damage. The different concentrations of H₂O₂ were used to induce oxidative stress in cells, thereby triggering cell death. The results of the 3-(4,5-dimethylthiazol-2-yl)-2,5-diphenyltetrazolium bromide (MTT) assay showed that LC-CDs at a concentration of 10 µg/mL could effectively reverse the cell death induced by H₂O₂ (Fig. 6F). During ischemia-reperfusion injury, ROS overproduction targets unsaturated fatty acids within the mitochondrial membrane, causing structural and functional damage that impairs ion and metabolite transport [43]. In this study, the JC-1 fluorescent probe was employed to evaluate changes in mitochondrial membrane potential in H9C2 cells following H₂O₂ stimulation. It was found that after H₂O₂ stimulation, the JC-1 aggregates decreased significantly, and the JC-1 monomers increased, indicating that oxidative stress damaged the mitochondrial membrane and severely disrupted mitochondrial function (Fig. 6G). However, after treatment with LC-CDs at different concentrations, the mitochondrial membrane potential underwent a notable restoration, and the results of fluorescence statistical analysis also supported this conclusion (Fig. 6J, K). During ischemia-reperfusion injury, a reduction in mitochondrial membrane potential triggers cytochrome C translocation into the cytoplasm, leading to the activation of apoptosis-related proteins. LC-CDs protect the energy-metabolism core structure of myocardial cells and effectively prevent the occurrence of apoptosis by maintaining the mitochondrial membrane potential under oxidative stress. After myocardial ischemia-reperfusion, the intense oxidative stress imbalance and inflammatory response can lead to severe DNA damage [44]. In particular, ROS can react with DNA bases and deoxyribose, causing damage to bases, glycosyl groups, and chains, ultimately leading to severe cell apoptosis and myocardial fibrosis. Immunofluorescence staining was used to detect the protective effect of LC-CDs on DNA damage induced by H₂O₂, with γ-H2AX as a marker of DNA damage. The findings revealed that LC-CDs at different concentrations suppressed γ-H2AX expression, suggesting their ability to mitigate oxidative stress-induced DNA damage in cells (Fig. 6H, L). In addition, the Annexin V/propidium iodide (PI) staining method was applied to identify early and late apoptosis of cells. During early apoptosis, cell membrane integrity is compromised, leading to the translocation of phosphatidylserine from the inner to the outer membrane surface. Annexin V can bind to phosphatidylserine (PS) on the outer side of the cell membrane, enabling the identification of early-apoptotic cells by flow cytometry. Flow cytometry analysis revealed that LC-CDs effectively suppressed H₂O₂-induced early apoptosis. As the concentration of LC-CDs attained 10 µg/mL, it could almost completely inhibit the early apoptosis of cells (Fig. 6I). In conclusion, the above-mentioned research results indicate that LC-CDs have a protective effect against mitochondrial damage, DNA damage, and cell apoptosis caused by oxidative stress. These effects are crucial during the process of MIRI, implying that LC-CDs may have a promising application prospect in the therapy for MIRI.
Evaluation of the cytoprotective effect of LC-CDs. (A) Fluorescent images of Raw264.7 cells labeled with CD86 in different treatment groups. (B) Flow cytometry results of Raw264.7 cells labeled with CD86 in different treatment groups. (C–E) qPCR analysis of pro-inflammatory cytokines (TNF-α, IL-1β, and IL-6) in different treatment groups. (F) Cell viability of different treatment groups. (G) Fluorescent images of JC-1 probe staining in different treatment groups (JC-1 agg: red; JC-1 mon: green). (H) Fluorescent images of γ-H2AX labeling in different treatment groups. (I) Flow cytometry results of Raw264.7 cells stained with Annexin V FITC/PI in different treatment groups. (J and K) MFI statistics of JC-1 probe staining in different treatment groups. (L) MFI statistics of γ-H2AX labeling in different treatment groups. LC-CDs 1: inducer + 5 µg/mL LC-CDs; LC-CDs 2: inducer + 10 µg/mL LC-CDs. Statistical comparisons were made using one-way ANOVA and a t-test. Statistical significance was indicated as *p < 0.05, **p < 0.01, ***p < 0.001. Data are expressed as mean ± SD (n = 3)
The therapeutic effect of LC-CDs on the MIRI model
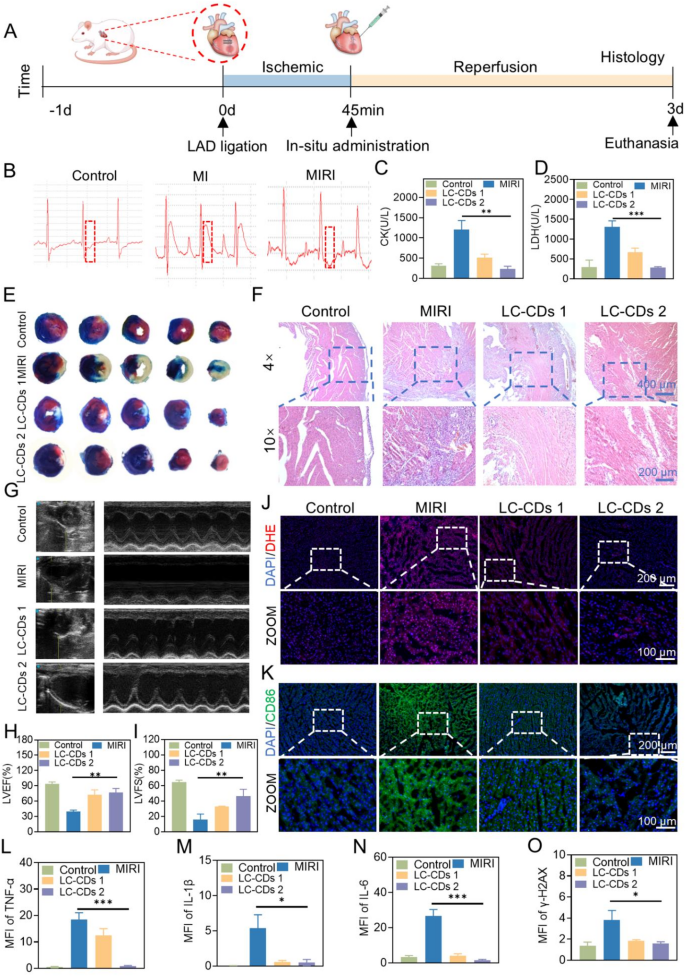
Given the remarkable anti-oxidative damage and anti-inflammatory effects of LC-CDs at the cellular level, this investigation set up a rat model of myocardial ischemia-reperfusion to assess the therapeutic efficacy of LC-CDs at the animal level. The model was constructed through surgery (Fig. 7A). Specifically, blood flow in the left anterior descending coronary artery was occluded, followed by restoration after 45 min to simulate the myocardial ischemia-reperfusion process. Meanwhile, in situ administration was performed on the rat heart. Three days after administration, the rats underwent transthoracic echocardiography and were then euthanized. To ensure the stability of the model, the electrocardiogram (ECG) of the rats was continuously monitored during the study. During the myocardial ischemia phase, the membrane potential of the ischemic myocardial cells decreases, creating a potential difference from the normal myocardium. This led to the generation of an injury current, causing the ST-segment elevation in the electrocardiogram leads. Therefore, ST-segment elevation is the most prominent electrocardiogram feature of myocardial ischemia. During the 45-minute myocardial ischemia period, the ST segment of the rat heart electrocardiogram was significantly elevated (Fig. 7B). The instant the blood flow was restored, the ST segment decreased, which fully demonstrated the successful construction of the rat myocardial ischemia-reperfusion model. In the treatment phase, this study selected two concentrations of LC-CDs (1 mg/kg and 5 mg/kg) to treat the rats to evaluate their efficacy. LC-CDs were administered to rats via local myocardial injection. When myocardial injury occurs, the cell membrane permeability increases, and creatine kinase (CK) and lactate dehydrogenase (LDH) are released into the blood. The levels of CK and LDH in the blood are crucial indicators for evaluating cardiac function. Based on this, the study collected the serum of treated rats at the identical time point for blood biochemical analysis. The results showed that myocardial injury led to a marked elevation in the levels of CK and LDH in the blood of the MIRI group rats. After treatment with different concentrations of LC-CDs, these two indicators significantly decreased, indicating that the cardiac function of the treated rats was improved (Fig. 7C, D). To analyze the infarct area of the rat heart after treatment, this study employed the TTC (2,3,5-triphenyltetrazolium chloride) and Evans blue staining methods. TTC can be reduced to red triphenylformazan (TPF) by dehydrogenases in living tissues, while dead cells cannot reduce TTC and thus appear white. Evans blue can stain the normally perfused areas of the rat heart tissue blue, and the non-stained areas are the at-risk areas of blood supply. In the at-risk areas, the parts stained white by TTC are the infarct areas. The staining results of different sections of the rat heart in the MIRI group showed that the rat heart had severe infarction, and almost all of the at-risk areas were infarcted (Fig. 7E). After treatment with LC-CDs, the infarct area in the at-risk areas decreased. After treatment with a high concentration of LC-CDs, the infarct area in the at-risk areas almost returned to normal (Fig. 7E). Given the outstanding therapeutic efficacy of LC-CDs, this study employed paraffin-embedded tissue sectioning and hematoxylin-eosin (H&E) staining to assess inflammatory cell infiltration in rat cardiac tissue. The results showed that in the infarct area of the MIRI group, a large number of inflammatory cell infiltrations and tissue damage were visible (Fig. 7F). This damage to the myocardial microenvironment was irreversible. After treatment with different concentrations of LC-CDs, the inflammatory infiltration in the infarct area was significantly reduced. Meanwhile, LC-CDs also reduced the blood cell leakage caused by ischemia-reperfusion. To evaluate the impact of LC-CDs on the physiological function of the rat heart, before euthanizing the rats, transthoracic echocardiography was used to measure the cardiac function parameters of rats in different groups, including left ventricular ejection fraction (LVEF), left ventricular fractional shortening (LVFS) (Fig. 7G). As depicted in Fig. 7H, in comparison with the healthy group (LVEF: 93.45% ± 4.29), the echocardiogram of the MIRI group rats showed weakened left ventricular anterior wall motion (LVEF: 39.99% ± 2.5%), indicating that the myocardial injury caused by myocardial ischemia-reperfusion might lead to cardiac systolic dysfunction. Fortunately, after in situ injection of LC-CDs, the left ventricular anterior wall motion of the rat heart was significantly restored. The LVFS of the low-concentration treatment group reached 72.22% ± 10%, and that of the high-concentration treatment group was 76.62% ± 8.41%. At the same time, the LVFS of the MIRI group significantly decreased (16.01% ± 7.15%). After treatment with LC-CDs, the LVFS also significantly recovered, and the high-concentration treatment group could reach 46.62% ± 8.60% (Fig. 7I). These results fully demonstrated that LC-CDs could repair the myocardial injury caused by myocardial ischemia and thus restore cardiac function. The oxidative stress state in the local area of the heart was further verified by the DHE probe. After ischemia-reperfusion, a vast amount of ROS bursts occurred at the damaged site of the heart. After treatment with LC-CDs, the ROS level was significantly reduced, greatly alleviating the oxidative damage to myocardial cells (Fig. 7J). Oxidative damage is often accompanied by immune infiltration. The previous H&E staining results have proven that LC-CDs can inhibit immune cell infiltration. Further, by labeling the surface marker CD86 of M1-type macrophages, the changes in M1-type macrophages in the infarct area of the heart were observed. The data indicated a notable rise in CD86 expression in the MIRI group, whereas LC-CDs treatment led to its reduction, suggesting a decline in M1-type macrophage levels within the cardiac tissue following LC-CDs administration (Fig. 7K). The flow cytometry results of M1 and M2 labeling of myocardial cells in different treatment groups show that after treatment with LC-CDs, it can not only reduce the M1 polarization of macrophages but also promote the M2 polarization of macrophages (Fig. S4). In addition, immunofluorescence was used to detect the expression levels of pro-inflammatory cytokines (TNF-α, IL-1β, and IL-6) in the heart tissue after different treatments. The findings revealed elevated expression levels of these three pro-inflammatory cytokines in the MIRI group, with varying degrees of upregulation. In contrast, the LC-CDs treatment group markedly decreased the levels of these pro-inflammatory cytokines, contributing to the stabilization of the cardiac immune microenvironment (Fig. S5B-D). The fluorescence statistical data also supported this conclusion (Fig. 7L-N). The qPCR results of the myocardial tissues also demonstrated the anti-inflammatory effectiveness of LC-CDs (Fig. S6). Meanwhile, immunofluorescence of γ-H2AX was also used to detect the DNA damage of myocardial cells (Fig. S5A). As expected, in the myocardial infarct area, the myocardial cells in the MIRI group had extensive DNA damage, while LC-CDs significantly inhibited this damage (Fig. 7O). In conclusion, LC-CDs markedly alleviate cardiac dysfunction induced by myocardial ischemia and shield myocardial cells against oxidative stress-induced injury. At the same time, it can inhibit immune cell infiltration, lower the synthesis of pro-inflammatory cytokines, and ultimately achieve rapid repair after myocardial ischemia-reperfusion.
The therapeutic effect of LC-CDs on MIRI. (A) Schematic diagram of the experimental procedure. (B) Electrocardiogram during the establishment of rat MIRI mode. (C and D) Contents of CK and LDH in the blood of rats in different treatment groups. (E) Evans blue/TTC staining of heart sections from rats in different treatment groups. (F) H&E pathological section staining of the hearts of rats in different treatment groups. (G) Transthoracic echocardiography of rats in different treatment groups. (H and I) LVEF and LVFS of the hearts of rats in different treatment groups. (J and K) DHE and CD86 immunofluorescence staining of the hearts of rats in different treatment groups. (L–O) Statistics of fluorescence intensity of immunofluorescence staining (TNF-α, IL-1β, IL-6, and γ-H2AX). LC-CDs 1: MIRI + 1 mg/kg LC-CDs; LC-CDs 2: MIRI + 5 mg/kg LC-CDs. Statistical comparisons were made using one-way ANOVA and t-test. Statistical significance was indicated as *p < 0.05, **p < 0.01, ***p < 0.001. Data are expressed as mean ± SD (n = 3)
RNA sequencing to explore biological mechanisms of LC-CDs
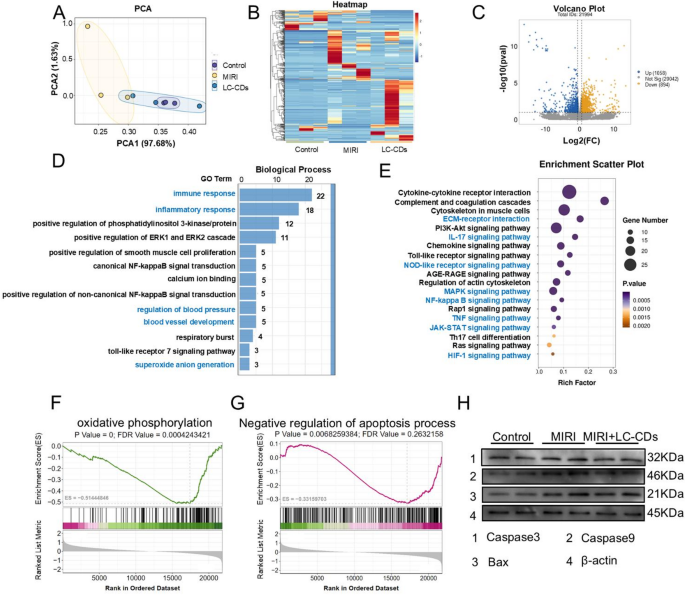
To deeply explore the specific mechanisms underlying the treatment of MIRI by LC-CDs, this study conducted RNA sequencing (RNA-seq) analysis on the treated rat hearts. The results of principal component analysis (PCA) clearly presented the differences among the three treatment groups: the Control group, the MIRI group, and the LC-CDs treatment group. Among them, the MIRI group exhibited the most pronounced differences in gene expression compared to the other two groups, whereas the heart tissue treated with LC-CDs displayed a profile closer to the control group (Fig. 8A). The gene-expression heatmap further revealed that there were significant gene-expression differences among the three treatment groups (Fig. 8B). Although there were also certain gene-expression differences among the three samples within each group, considering that this difference might be attributed to the natural inter-individual variations, it had no substantial impact on the final results. Subsequently, the gene-expression profiles of rat hearts treated with LC-CDs were compared with those of the MIRI group. The volcano plot revealed a substantial number of genes with differential expression across the two sample groups (Fig. 8C). After treatment with LC-CDs, a total of 1058 genes were upregulated, and 894 genes were downregulated. The results of gene ontology (GO) and Kyoto Encyclopedia of Genes and Genomes (KEGG) enrichment analyses for these differentially expressed genes are presented as follows. In the GO analysis, biological processes were the key focus. The results revealed that differentially expressed genes were notably associated with biological processes including immune and inflammatory responses, blood pressure regulation, blood vessel development, and superoxide anion production (Fig. 8D). This suggests that LC-CDs primarily modulate disease progression during MIRI repair by targeting pathways involved in immune regulation and superoxide radical production. In the KEGG enrichment analysis, the specific signaling pathways affected by LC-CDs were identified, including ECM-receptor interaction, IL-17 signaling pathway, NOD-like receptor signaling pathway, MAPK signaling pathway, NF-kappa B signaling pathway, TNF signaling pathway, JAK-STAT signaling pathway, and HIF-1 signaling pathway (Fig. 8E). Next, to further verify the effect of LC-CDs on the aforementioned signaling pathways, we carried out a more in-depth statistical analysis of the key downstream genes within these signaling pathways. The results showed that after treatment with LC-CDs, the expression levels of the key genes in these pathways all returned to the same state as those of the control group. This result strongly indicates that LC-CDs can effectively regulate the relevant signaling pathways (Fig. S7). In addition, gene-set enrichment analysis (GSEA) provided a comprehensive assessment of differential gene expression at the gene-set level. The GSEA results showed that two pathways, oxidative phosphorylation and Negative regulation of the apoptosis process, underwent significant changes after LC-CDs treatment (Fig. 8F, G). This discovery aligns with the outcomes of previous network-pharmacology analyses regarding the mechanisms by which Ligusticum Chuanxiong affects MIRI. Furthermore, western blotting results demonstrated that LC-CDs inhibited apoptosis through downregulation of key proteins, including Caspase3, Caspase9, and Bax (Fig. 8H).
RNA sequencing to explore biological mechanisms of LC-CDs. (A) PCA analysis of the Control, MIRI, and MIRI + LC-CDs groups. (B) Heat map of genes in different treatments. (C) Volcano plots of all genes in the MIRI + LC-CDs group and the MIRI group. The blue dots represented the upregulated differently expressed genes, the yellow dots were downregulated differently expressed genes, and the grey dots were non-differentially expressed genes. (D) GO enrichment of differential genes in MIRI + LC-CDs and MIRI groups. (E) KEGG enrichment of differential genes in MIRI + LC-CDs and MIRI groups. (F and G) GSEA enrichment analysis of differentially expressed genes (oxidative phosphorylation and Negative regulation of apoptosis process). (H) Expression of key proteins in the apoptosis pathway (Caspase3, Caspase9, and Bax)
Biosafety evaluation of LC-CDs
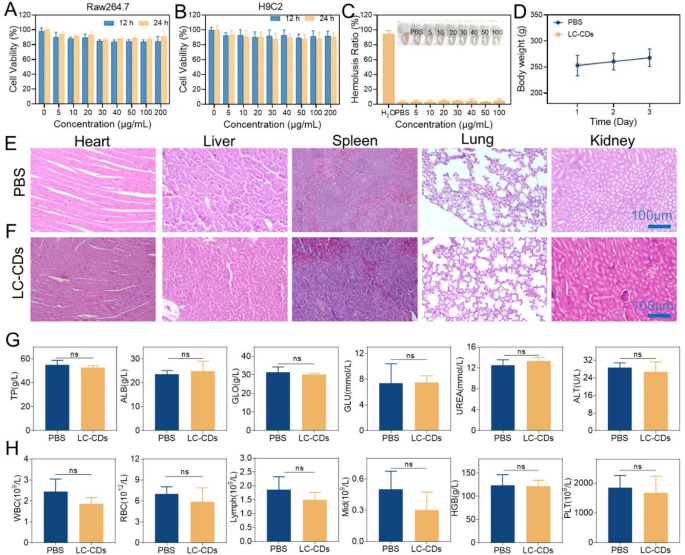
The biosafety of ultrasmall carbon nanoparticles has always been a focus in the research field. This study first investigated the effects of LC-CDs on Raw264.7 cells and H9C2 cells at the cellular level. Encouragingly, even when the concentration of LC-CDs reached 200 µg/mL, the MTT assay results showed that after 24-hour co-incubation with Raw264.7 cells, the cell viability remained greater than 80% (Fig. 9A). Similarly, in the H9C2 cell experiment, H9C2 cells also maintained good cell viability after co-incubation with LC-CDs (Fig. 9B). Regarding blood safety, it was evaluated through a hemolysis experiment. After co-incubating different concentrations of LC-CDs with blood cells for 4 h, no abnormal phenomena were observed in the blood cells, indicating that LC-CDs had good safety in the blood (Fig. 9C). To assess the in vivo safety of LC-CDs in animals, LC-CDs were injected in situ into the rat hearts. After three consecutive days of observation, the drug-administered group exhibited a normal growth trend in body weight compared to the healthy group (Fig. 9D). Pathological sections of the main organs of rats, including the heart, liver, spleen, lungs, and kidneys, were prepared and observed by H&E staining. The findings indicated that the heart tissue and other major organs in the drug-administered group exhibited no significant pathological alterations, confirming that LC-CDs did not induce severe damage to these organs (Fig. 9E, F). Furthermore, the effects of LC-CDs on the functions of the main organs were evaluated through blood biochemical and blood routine tests. Analysis of blood biochemical indicators showed no significant differences in levels of Total Protein, Alanine Aminotransferase, and other markers between the drug-administered group and the control or healthy groups, suggesting that LC-CDs did not significantly affect liver function (Fig. 9G). The Albumin and Globulin indicators also showed no differences, suggesting that LC-CDs did not trigger an immune response in rats. The normal Glucose and Urea indicators indicated that the blood-glucose level and kidney function of the drug-administered group of rats were not impaired (Fig. 9G). The blood-routine indicators showed that there were no obvious differences in the blood conditions between the LC-CDs-treated group of rats and the healthy rats (Fig. 9H). In summary, the above results fully demonstrate that LC-CDs possess excellent biosafety.
Biosafety evaluation of LC-CDs. (A) Cell viability of different concentrations of LC-CDs incubated with Raw264.7 for 12 h and 24 h. (B) Cell viability of different concentrations of LC-CDs incubated with H9C2 for 12 h and 24 h. (C) Hemolysis test. (D)Changes in body weight of rats in different treatment groups (n = 3 mice). (E) H&E staining of major organs for biosafety in healthy groups of mice. (F) H&E staining of major organs for biosafety in the LC-CDs groups of mice. (G) Blood biochemistry analysis results of the above mice. (H) Complete blood panel analysis results of LC-CDs-treated mice. Statistical comparisons were made using one-way ANOVA and t-test. “ns” represents “no statistically significant difference”. Data are expressed as mean ± SD (n = 3)


