Synthesis and characterization of CDots
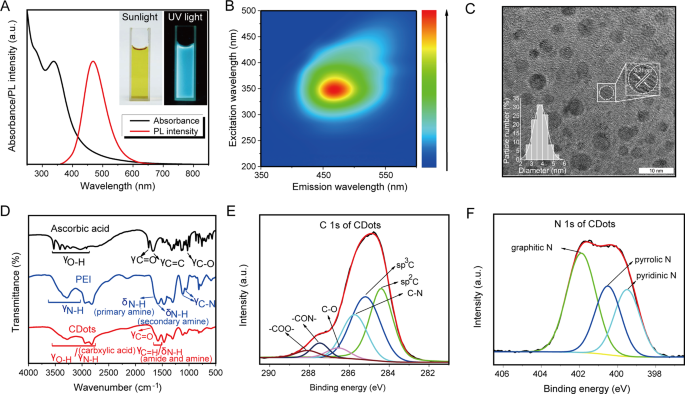
In this study, carbon dots (CDots) were synthesized through a one-step microwave approach using ascorbic acid and PEI [16]. Under sunlight, the as-prepared CDots solutions exhibited a pale yellow, transforming into a bright blue photoluminescence (PL) under ultraviolet (UV) radiation (Fig. 1A). The CDots solutions’ PL spectrum had a single emission peak at approximately 460 nm with a 350 nm excitation wavelength, in contrast to ascorbic acid and PEI which showed no PL emission under UV light (Fig. 1B and Figure S1A). High-resolution transmission electron microscopy (HRTEM) revealed that the CDots were uniform in morphology and had a consistent diameter of 3.5 nm(Figure 1C). The observed lattice spacing of 0.21 nm corresponds to the (100) planes of graphene carbon, implying a graphene-like structure [17]. The CDots had a 15.7 mV potential (Figure S1B). Energy-dispersive X-ray spectroscopy (EDS) analysis demonstrated that CDots contained C, N and O elements (Figure S1C). The Fourier-transform infrared spectroscopy (FTIR) spectra of ascorbic acid, exhibited C-O stretching vibrations at 1027 cm− 1, C = O stretching vibrations at 1753 cm− 1, and O-H stretching vibrations between 2916 and 3525 cm− 1, suggesting the presence of carboxyl and hydroxyl groups (Fig. 1D). The FTIR spectra of PEI revealed two C-N stretching vibrations at 1120 and 1057 cm− 1 and two N-H bending vibrations at 1662 and 1593 cm− 1, indicative of primary and secondary amines (Fig. 1D). The FTIR spectra of these CDots showed O-H/N-H stretching vibrations between 2800 and 3600 cm− 1 and a C = O stretching vibration at 1720 cm− 1, indicating the presence of carboxyl and amine groups (Fig. 1D). Additionally, a broad band at 1592 cm− 1 encompassed C = O stretching (amide I band), N-H bending (amide II band), and free amine N-H bending vibrations, resulting in the overlap of amide I and II bands.
Characterizations of CDots. (A) PL emission spectra (red) and UV–vis absorption (black) of CDots. Insets: photographs of CDots solution taken under UV light (right) and sunlight (left), respectively. (B) The excitation-emission map of CDots. (C) HRTEM image of CDots. (D) FTIR spectra of CDots (red), PEI (blue) and ascorbic acid (black). (E–F) High-resolution XPS spectra of CDots: E is C 1s, F is N 1s
These results confirmed that the formation of CDots was due to dehydration condensation and further carbonization between ascorbic acid and PEI, with a multitude of functional groups present in the CDots, as further evidenced by X-ray photoelectron spectroscopy (XPS) characterization. The C 1s spectrum of ascorbic acid revealed four peaks at 284.7, 285.7, 286.6, and 288.4 eV, corresponding to sp2 C, sp3 C, C-O, and -COO- groups. The N 1s spectrum of PEI, centered at 399.9 eV (Figure S1D), was associated with amine (-NH-) groups. In contrast, the C 1s spectrum of the CDots comprises six peaks at 284.6, 285.4, 285.9, 286.7, 287.7, and 288.3 eV (Fig. 1E), representing sp2 C, sp3 C, C-N, C-O, -CON-, and -COO- groups. The presence of -CON- was due to the amidation reaction between ascorbic acid and PEI, while the sp2 C species indicated the existence of highly conjugated sp2 domains in the CDots, consistent with HRTEM results (graphene-like structures) (Fig. 1C). Furthermore, the N 1s spectrum of the CDots showed three peaks at 399.3, 400.5, and 401.9 eV (Fig. 1F), attributable to pyridinic, pyrrolic, and graphitic nitrogen, indicating the presence of heterocyclic bases. In summary, these results revealed the formation process of the CDots and the presence of functional groups within them.
CDots exhibit excellent biocompatibility
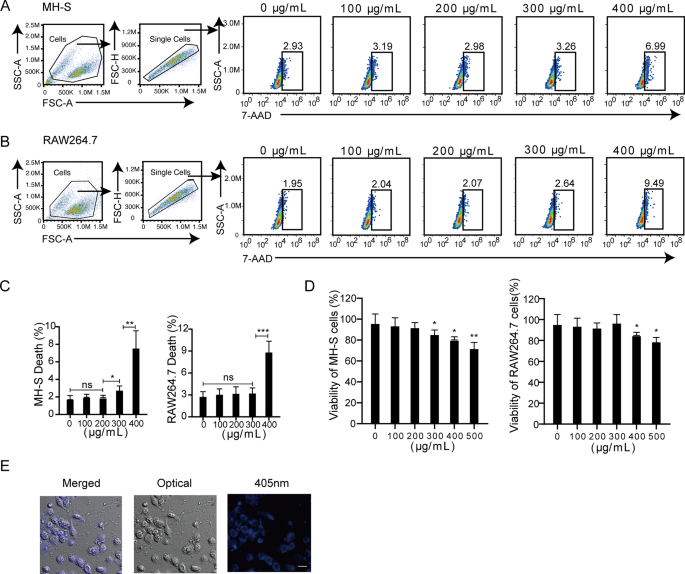
Biocompatibility is a crucial prerequisite for CDots applications. In this regard, we evaluated the effects of CDots on cell viability and found that CDots exhibited no significant cytotoxic effects on both mouse alveolar macrophage MH-S cells and mouse macrophage RAW264.7 cells at concentrations below 200 µg/mL. However, significant cytotoxic effects were observed at concentrations of 300 and 400 µg/mL(Fig. 2A-C). Consistent with the flow cytometric results, CCK-8 assays corroborated that a CDots concentration of 200 µg/mL did not significantly impact the cell viability of both MH-S and RAW264.7 cells (Fig. 2D). Therefore, for subsequent experiments, a CDots solution at a concentration of 200 µg/mL was selected. Macrophages have an intrinsic phagocytic function, which can swallow exogenous substances into the host cells [18]. Based on the blue fluorescence property of CDots, we traced the intracellular presence of CDots in MH-S cells using laser confocal scanning microscopy (CLSM). CDots could enter and persist in mouse macrophage cells for at least 24 h (Fig. 2E). Thus, these results reveal the excellent biocompatibility of CDots with cells.
Cytotoxicity assays and imaging of CDots in mouse macrophages. (A–C) Representative gating Strategies (A–B) and quantification of cell death (C) by 7-AAD staining. MH-S and RAW264.7 cells were treated with CDots at indicated concentrations. (D) Quantification of CCK-8 assays. MH-S and RAW264.7 cells were treated with CDots at indicated concentrations. (E) Cell imaging of CDots-treated MH-S cells, which are merged image, optical image, and CLSM (405 nm) image from left to right. Statistical significance was analyzed by the two-tailed Student’s t-test. Data are presented as mean ± SD from three independent experiments. *p < 0.05, **p < 0.01, ***p < 0.001. Scale bar = 10 μm
CDots exert a therapeutic effect on bacterial pneumonia in mice
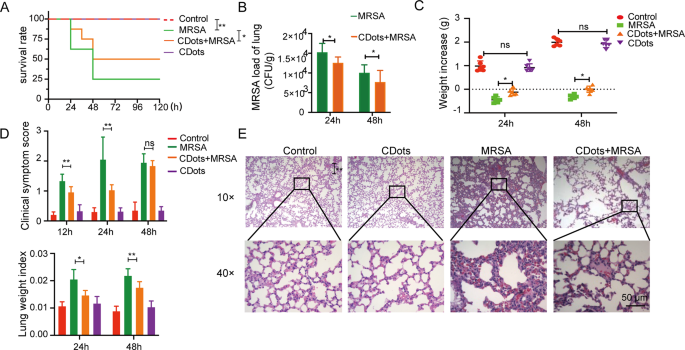
The toxicity of CDots was first investigated in mice by intravenous injection of CDots. Hematoxylin and eosin (H&E) staining revealed that 48 h after administering CDots, there was no significant damage observed in various organs compared to the control group (Figure S2), demonstrating the biocompatibility of CDots and their suitability for further in vivo studies. To assess the therapeutic efficacy of CDots, we established MRSA or K. pneumoniae-induced pneumonia model in mice, who were treated with an intravenous injection of CDots 6 h post-infection. Compared to the bacterial infection group, CDots treatment significantly enhanced the survival rates of mice, and markedly reduced lung bacterial loads (Fig. 3A-B, Figure S3A-B), weight loss, clinical scores, and lung indices, amongst other clinical indicators (Fig. 3C-D, Figure S3C-D). Additionally, H&E staining of lung tissues at 24 h post-infection with MRSA and K. pneumoniae revealed extensive neutrophil infiltration, tissue degeneration, necrosis, abundant fibrin exudation, and erythrocyte extravasation in the alveoli. Remarkably, there were almost no red blood cells observed engaging in normal gas exchange within the alveoli. CDots treatment, however, substantially mitigated the aforementioned pathological damage (Fig. 3E, Figure S3E). Furthermore, to investigate the impact of the ratio of ascorbic acid to PEI on therapeutic efficacy, we synthesized additional batches of CDots by increasing the amount of ascorbic acid (resulting in a 0.25:1 ratio of PEI to ascorbic acid) or the amount of PEI (resulting in a 1:1 ratio of PEI to ascorbic acid) (Figure S4A). These CDots with different proportions exhibited similar UV-visible spectra (Figure S4B), and therapeutic efficacy (Figure S4C-J). Together, these in vivo results demonstrate that CDots exerted a therapeutic effect on MRSA and K. pneumoniae-induced bacterial pneumonia in mice.
Evaluation of the therapeutic effect of CDots on bacterial pneumonia in mice. (A) The survival rate of the mice in different treatment groups (n = 8). (B) Bacterial loads in murine lung homogenate (n = 6). (C–D) Clinical index of the mice in different treatment groups, including weight increase (C), clinical symptom score (D), and lung weight index (D) (n = 6). (D) H&E staining results of lung pathological sections in different groups. Statistical significance was analyzed by the two-tailed Student’s t-test. Data are presented as mean ± SD from three independent experiments. *p < 0.05, **p < 0.01, ***p < 0.001. Scale bar = 50 μm
CDots Promote the M1 Polarization of Macrophages to Augment Their Cell Vitality and Phagocytic Antimicrobial Effects.
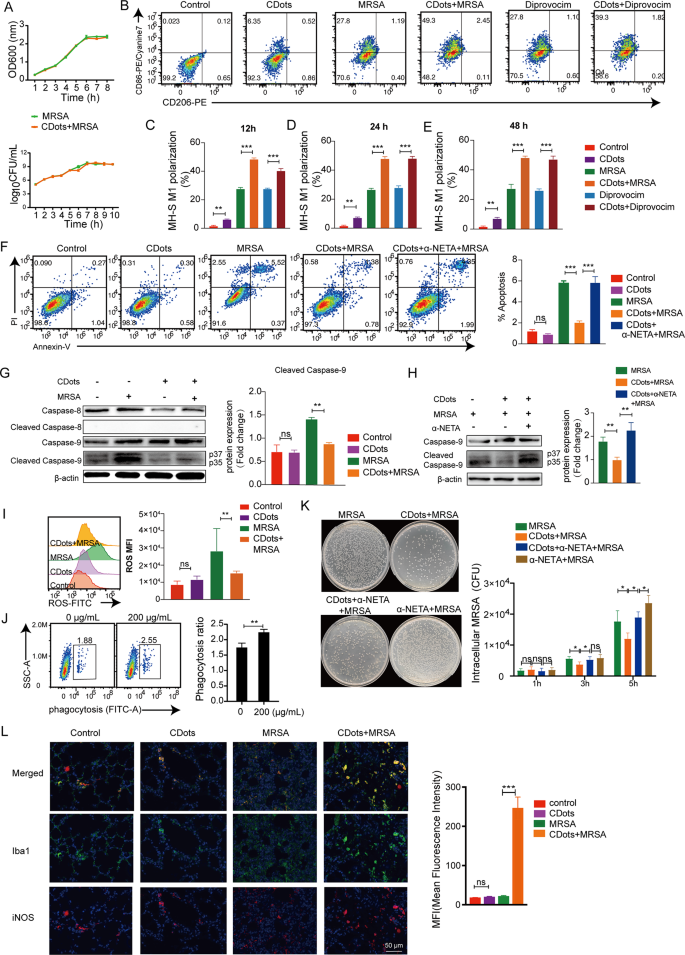
In the realm of resisting pathogenic microbial infections, CDots have been mainly designed to directly target the bacteria to elicit antimicrobial effects [19]. Therefore, the as-prepared CDots were first introduced directly into the bacterial culture medium of MRSA and K. Pneumoniae to observe their direct bactericidal capabilities. Surprisingly, CDots exhibited no significant inhibitory effect on the proliferation of both MRSA and K. Pneumoniae (Fig. 4A, Figure S5A).
Effects of CDots on macrophage polarization, cell vitality, phagocytosis, and sterilization. (A) The long curve measurement and colony count were measured for MRSA with or without CDots. (B-E) Representative gating strategies for CD206 and CD86 expression in MH-S cells and quantification of CD86+ macrophages after indicated treatments. (F) Representative flow cytometric plots and quantification of cell apoptosis. (G) Western blot results of caspase-8, cleaved caspase-8; caspase-9 and cleaved caspase-9 of MH-S cells treated as indicated. (H) Western blot results of caspase-9 and cleaved caspase-9 of MH-S cells treated as indicated. (I) Flow cytometry analysis of intracellular ROS changes in MH-S cells. (J) Flow cytometric analysis of the phagocytosis of MH-S cells with or without CDots treatments. (K) Representative images of bacteria after 5 hours’ infection and the quantification of bacterial colonies with indicated treatments. (L) The expression of iNOS+ macrophages in murine lung sections was evaluated by immunohistochemistry (Iba1+: green; iNOS+: red; DAN: blue). The histogram showed the average fluorescence intensity of Iba 1 and iNOS co-localization. Statistical significance was analyzed by the two-tailed Student’s t-test. Data are presented as mean ± SD from three independent experiments. *p < 0.05, **p < 0.01, ***p < 0.001
Following this, we further explored whether CDots exert their antibacterial effects by modulating macrophage function. Flow cytometric analysis revealed that, with or without MRSA, K. pneumoniae, TLR2 agonist (Diprovocim) and TLR4 agonist (RS 09) stimulation, CDots significantly enhanced the proportion of CD86+ M1-type macrophages (Fig. 4B-E, Figure S5B-F). Extending the incubation time of CDots had no significant effects on the proportion of macrophage polarization (Fig. 4C-E, Figure S5D-F). In addition, cell apoptosis detection demonstrated that CDots significantly reduced macrophage apoptosis following infection with MRSA and K. Pneumoniae (Fig. 4F, Figure S5G-H). Next, we explored the pathways in which CDots specifically affected apoptosis, and found CDots could decrease MRSA-induced apoptosis by reducing the expression of cleaved caspase-9 (Fig. 4G). However, the M1 polarization inhibitor (α-NETA) markedly mitigated this protective effect through cleaved caspase-9 (Fig. 4H), suggesting that CDots can protect macrophages from apoptosis during MRSA infection by promoting M1 polarization. At the same time, CDots treatment could scavenge excess ROS (Fig. 4I, Figure S5I). Moreover, CDots enhanced the phagocytic capacity of mouse alveolar macrophages (Fig. 4J, Figure S5J ). CDots addition could remarkably reduce the intracellular bacterial load in macrophages whereas this effect was negated when an M1 polarization inhibitor was added (Fig. 4K, Figure S5K). Consistent results were obtained when using mouse macrophages RAW264.7 (Figure S6). Furthermore, the M1 polarization of macrophages in murine lungs following CDots administration was investigated. Consistent with the results of in vitro experiments, CDots could significantly increase the frequencies of lung iNOS+ M1-macrophages in MRSA infection (Fig. 4L). Taken together, these results demonstrated that CDots could promote the M1 polarization of macrophages to augment their cell vitality and phagocytic bactericidal activity.
CDots promote macrophage M1 polarization by inhibiting the activation of PI3K/AKT/mTOR signaling pathway
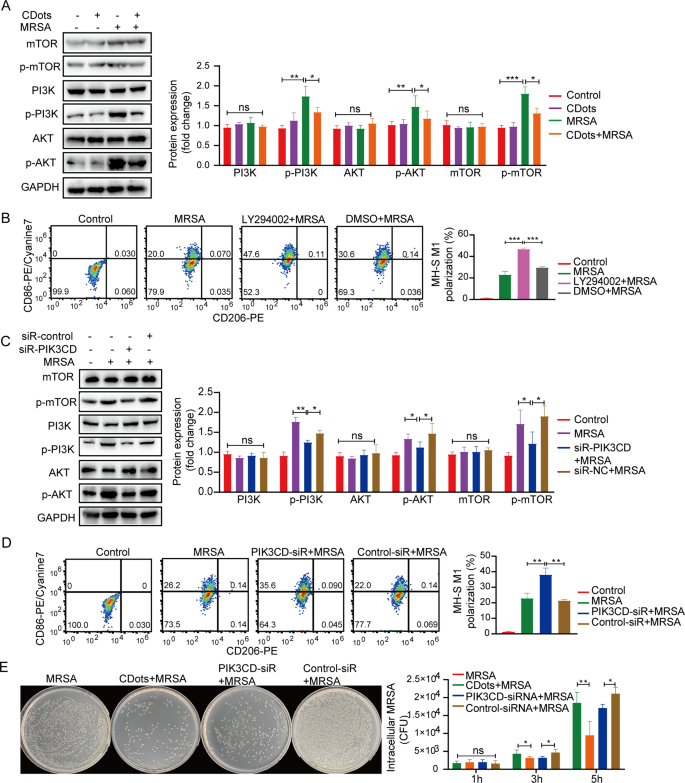
Numerous studies have established a strong association between the M1 polarization process and the activation of the PI3K/AKT/mTOR signaling pathway [20]. We further explore the relationship between CDots-promoted M1 polarization and the PI3K pathway. After MRSA or K. pneumoniae infection, the protein expression levels of p-PI3K, p-AKT, and p-mTOR significantly increased, whereas CDots notably diminished the phosphorylation levels of these proteins (Fig. 5A, Figure S7A). Subsequently, the PI3K signaling pathway inhibitor LY294002 was used to examine its effects on macrophage polarization. Both the PI3K pathway inhibitor and CDots significantly promoted the macrophage M1 polarization, suggesting that CDots could promote M1 polarization of macrophage by inhibiting the activation of the PI3K signaling pathway (Fig. 5B, Figure S7B). PIK3CD, the catalytic subunit of PI3K, plays a crucial role in activating the PI3K signaling pathway [21]. To ascertain whether CDots exert their effects by targeting PIK3CD, we investigated the effects of PIK3CD knockdown on macrophages. Compared to the Control-SiR group, the protein levels of p-mTOR, p-PI3K, and p-AKT were significantly reduced in the siRNA-PIK3CD group for both MH-S and RAW264.7 cells (Fig. 5C, Figure S7C and Figure S8A). Furthermore, PIK3CD knockdown increased the proportion of CD86+ M1 macrophages (Fig. 5D, Figure S7D) and enhanced the bactericidal activity of macrophages, similar to those observed with CDots (Fig. 5E, Figure S7E and Figure S8B). Thus, these data suggested that CDots could target PIK3CD to inhibit the activation of the PI3K signaling pathway, subsequently promoting M1 polarization.
CDots argument M1 polarization via inhibiting the PI3K/AKT/mTOR signaling pathway. (A, C) Western blot results of PI3K, p-PI3K, AKT, p-AKT, mTOR, and p-mTOR, of MH-S cells treated as indicated. (B, D) Flow cytometric analysis of CD206 and CD86 expression in MH-S cells with indicated treatments. (E) Representative images of bacteria after 5 hours’ infection and the colonies of bacteria with different treatments. Statistical significance was analyzed by the two-tailed Student’s t-test. Data are presented as mean ± SD from three independent experiments. *p < 0.05, **p < 0.01, ***p < 0.001, ****p < 0.0001
CDots can directly bind to PIK3CD
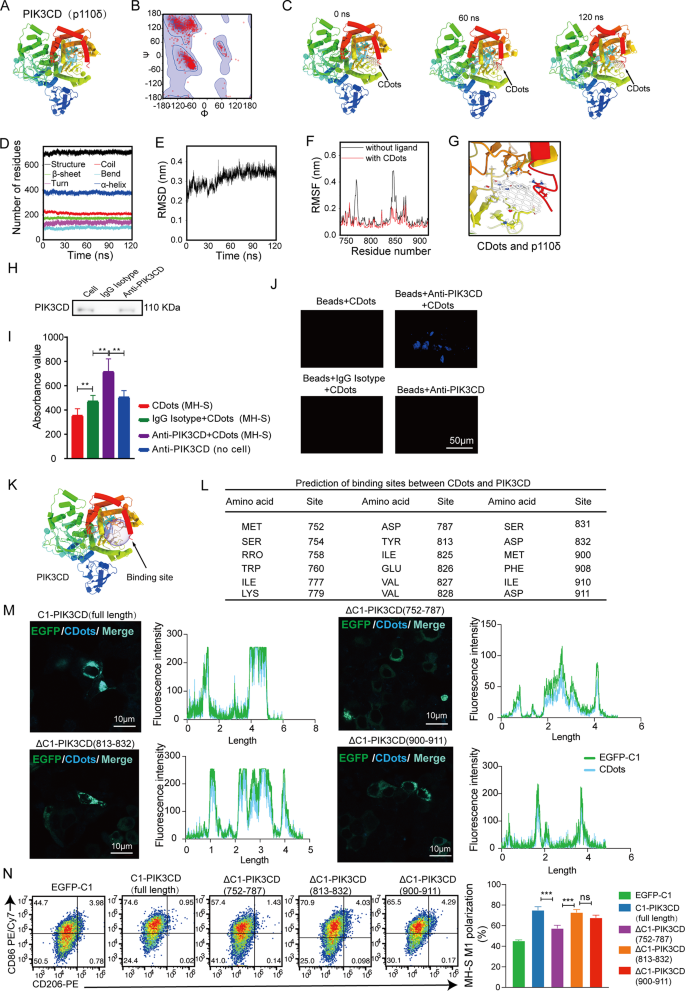
CDots have been demonstrated to modulate macrophage function through the PI3K signaling pathway, we next explored the potential interaction mechanisms between PIK3CD and CDots. The zeta potential of CDots is positive, whereas PIK3CD carries a negative charge, providing a basis for electrostatic attraction between the two. Based on this structure, we hypothesize that CDots interact with PIK3CD to form stable complexes, exerting biological effects. Molecular dynamics simulations were first conducted to assess the stability of the complexes. A simplified model of CDots, represented by a graphene-like fragment, was attached to the ligand molecule, and the PIK3CD structure was constructed using the homology modeling method [22], based on structures obtained from the RCSB Protein Data Bank (PDB ID: 2WXF) (Fig. 6A). The quality of the homology model was validated, with over 99% of PIK3CD residues located within the allowed regions of the Ramachandran plot (Fig. 6B). Molecular dynamics simulations were performed for 120 ns, and the simulation trajectory was captured through snapshot images (Fig. 6C and Movie S1). Throughout the entire simulation duration, the CDots remained bound to the CDots-PIK3CD complex, indicating strong binding affinity. The secondary structures of PIK3CD, including α-turns, helices, β-bridges, and β-sheets, remained nearly unchanged throughout the simulation (Fig. 6D). The structural stability of the complex was further confirmed by the root mean square deviation (RMSD), which rapidly stabilized with minimal fluctuations (Fig. 6E). These results suggest that CDots do not adversely affect the structural integrity of PIK3CD. Following this, we assessed the root mean square fluctuation (RMSF) of each amino acid residue in PIK3CD to evaluate their positional variance. Before examining the RMSF within the complex, a 120 ns molecular dynamics simulation of the PIK3CD, in the absence of any ligand, was performed. The RMSF values obtained for PIK3CD were used as a reference for comparison. The RMSF showed that the amino acid residues of PIK3CD in the CDots-PIK3CD complex were more restrained compared to the free PIK3CD, indicating strong interactions between PIK3CD and CDots (Fig. 6F and G).
Molecular dynamics simulation and verification of interaction between CDots and PIK3CD. (A) Three-dimensional structure of PIK3CD. Secondary structural elements are depicted as tube helices. (B) Ramachandran plot of PIK3CD. (C) The structures of CDots binding to PIK3CD, which are extracted from the molecular dynamics simulation trajectory at 0, 60, and 120 ns, respectively. (D) The variation in the numbers of residues within different secondary structures of PIK3CD throughout the simulation. (E) RMSD of the Cα atoms of PIK3CD in PIK3CD-CDots complex against time. (F) RMSF values of PIK3CD and in the PIK3CD-CDots complex, respectively. (G) 3D diagram of the interaction between CDots and PIK3CD. Amino acid residues involved in the binding of CDots are drawn as sticks. (H) The Immunoprecipitation experiment of PIK3CD. Western blotting showed that there was a clear PIK3CD band after Anti-PIK3CD IP, which proved that the PIK3CD antibody had bound PIK3CD. (I) The fluorescence data of the immunoprecipitation complex after removing the beads were collected with a VICTOR X5 Multilabel Plate Reader. CDots (MH-S) represents immunoprecipitation obtained without antibody; IgG Isotype + CDots (MH-S) represents immunoprecipitation obtained using isotype control; Anti-PIK3CD + CDots (MH-S) represents immunoprecipitation obtained using PIK3CD antibody; Anti-PIK3CD + CDots (no cell) represents immunoprecipitation obtained using PIK3CD antibody without cells. (J) The fluorescence of immunoprecipitation complexes with beads was detected by confocal images. *p < 0.05, **p < 0.01. Scale bar = 50 μm. (K)Molecular dynamics simulation trajectory prediction of the structural domain of CDots binding to PIK3CD. (L) Table of amino acid residues in PIK3CD with potential interactions with CDots obtained from molecular dynamics simulations. (M) Laser confocal microscopy displays the binding of CDots to PIK3CD and its deletion forms, where green fluorescence represents the expression of PIK3CD and its deletion forms, and blue fluorescence represents CDots. The scale bars = 10 µ m /20 µ m, respectively. Histogram represents fluorescence intensity analysis of EGFP-C1 (green line) and CDots (blue line) in 293T cells. (N) The representative flow cytometry plots show the M1polarization level in MH-S cells after CDots bind to PIK3CD and its deletion
Furthermore, the interaction between CDots and PIK3CD within MH-S cells was validated using adjusted immunoprecipitation combined with laser confocal technology. Following the treatment, PIK3CD was precipitated using PIK3CD antibody or isotype antibody attached to magnetic beads, with a control group set up for cell infection without immunoprecipitation. After eluting the immunoprecipitated complex and collecting the liquid, Western blot analysis revealed a distinct PIK3CD band in the PIK3CD antibody (anti-PIK3CD) group compared to the Isotype IgG group, indicating successful binding of PIK3CD molecules by the antibody (Fig. 6H). Utilizing the fluorescent properties of CDots, full-wavelength enzyme-linked immunosorbent assay (ELISA) detected significantly higher values in the Anti-PIK3CD group compared to the Isotype IgG group (Fig. 6I), confirming the presence of CDots in the PIK3CD bound. Further laser confocal analysis confirmed a significant increase in blue light in the Anti-PIK3CD group compared to the isotype control group (Fig. 6J), validating the interaction between CDots and PIK3CD. Finally, the binding domains of CDots and PIK3CD were investigated and found that the key functional domain of PIK3CD was located within the amino acid residues 752 to 911 through molecular dynamics simulations (Fig. 6K-L). To further identify potential binding domains between CDots and PIK3CD, we truncated amino acids 752–787, 813–832, and 900–911 of PIK3CD, respectively, and constructed EGFP-C1 vectors with full-length and three types of PIK3CD amino acid sequence deletions. The results showed that when the 752–787 amino acid residues of PIK3CD were deleted, the binding intensity of CDots to PIK3CD was weaker, and macrophages exhibited lower M1 polarization levels compared with full-length and other deletions (Fig. 6M-N). Thus, these data suggested that CDots could directly bind to PIK3CD and the critical domain for the binding was located in amino acids 752–787 of PIK3CD.


