Constructing green and efficient OAAs based on copper internalization
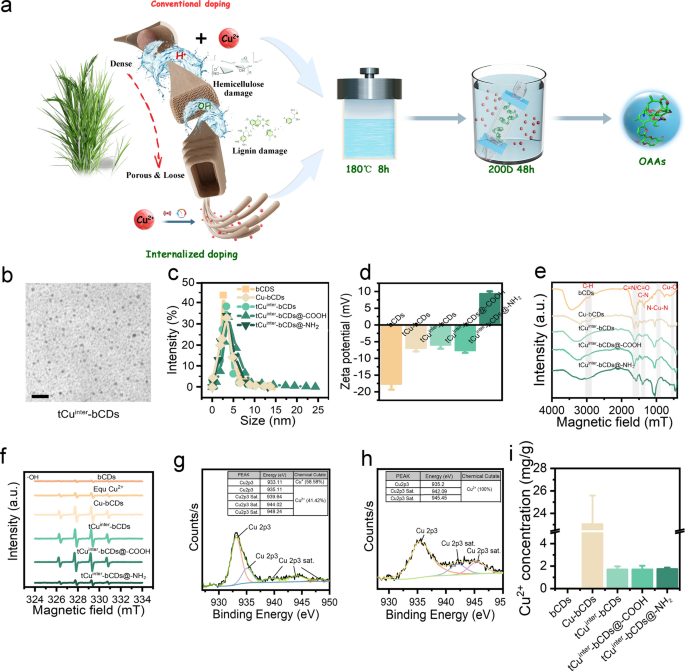
Using agricultural waste biomass straw as a carbon source, different doping schemes and modification methods were employed to prepare various types of OAAs (Fig. 1a), including bCDs, Cu-bCDs, tCuinter-bCDs, tCuinter-bCDs@-COOH, and tCuinter-bCDs@-NH2. Characterization of bCDs, Cu-bCDs, tCuinter-bCDs, and their surface-modified counterparts is illustrated in Fig. 1. Transmission electron microscopy (TEM) showed the morphological features of bCDs, Cu-bCDs, tCuinter-bCDs, tCuinter-bCDs@-COOH, and tCuinter-bCDs@-NH2, with an average particle size distribution ranging from 2.90 to 4.51 nm (Fig. 1b, c, S1). Potential measurements indicated bCDs had a potential of − 17.67 mV, while Cu-bCDs, tCuinter-bCDs, and tCuinter-bCDs@-COOH showed negative potentials of − 6.94 mV, − 5.97 mV, and − 7.65 mV, respectively, tCuinter-bCDs@-NH2 displayed a positive potential of + 9.37 mV (Fig. 1d). Fourier transform infrared spectroscopy (FTIR) analysis confirmed copper doping and functional group modifications (Fig. 1e), with peaks at 2943 cm−1 attributed to C–H stretching vibrations, and those at 1634 cm−1 to C=O/C=N stretching vibrations. C–C and C–N stretching vibrations were observed at 1660 cm−1 and 1348 cm−1, respectively. Peaks between 900 cm−1 and 1100 cm−1 were attributed to N–Cu–N stretching vibrations, and the peak at 531 cm−1 to Cu–O vibrations, indicating successful copper doping [30].
OAAs synthesis and characterization. a Schematic illustration depicting conventional copper ion doping and internalized doping synthesis. b Transmission electron microscope (TEM) images display tCuinter-bCDs, the scale bar represents 20 nm. c–e Particle size, electrochemical potential, and Fourier-transform infrared spectroscopy (FTIR) analyses are presented for OAAs synthesized through various schemes and modifications. f. Hydroxyl radicals (·OH) induction levels in various materials are shown. g–h Cu 2p scans of tCuinter-bCDs and tCuinter-bCDs@-NH2, conducted via X-ray photoelectron spectroscopy (XPS), are depicted. i. Copper ion content in OAAs is documented
The efficient induction of radicals is crucial for the degradation of plant viruses. Electron paramagnetic resonance (EPR) tests were performed to analyze the yields of oxygen radicals (O2·−) (Figure S2a), singlet oxygen (1O2) (Figure S2b), and hydroxyl radicals (·OH) (Fig. 1f). Results showed that the generation of 1O2 during OAAs treatment was relatively low. Nonetheless, Cu-bCDs, tCuinter-bCD, and tCuinter-bCD@-COOH exhibited higher levels of O2·− and ·OH production, with comparable amounts. This suggests that these OAAs possess enhanced capabilities to induce oxidative stress. Numerous studies have demonstrated that O2·− radicals, produced as byproducts of photocatalytic reactions through energy transfer [31,32,33], do not participate in peptide hydrolysis, whereas ·OH is known for its protein-cleaving abilities [34]. Thus, the primary mechanism for protein degradation appears to be the induction of ·OH by OAAs, while the contributions of 1O2 and O2·− are minimal. Consequently, tCuinter-bCDs and tCuinter-bCDs@-COOH have emerged as the most effective OAAs for protein degradation.
To further elucidate the elemental valence state composition of OAAs modified with different charges, X-ray photoelectron spectroscopy (XPS) analysis was conducted. The full XPS spectra of tCuinter-bCDs and tCuinter-bCDs@-NH2 revealed three distinct peaks at 284.1 eV, 531.0 eV, and 933.4 eV (Figure S3a), corresponding to C 1 s, O 1 s, and Cu 2p, respectively. bCDs exhibited only two peaks, corresponding to C 1 s and O 1 s (Figure S3a, b). Further high-resolution XPS analysis of the C 1 s band in tCuinter-bCDs and tCuinter-bCDs@-NH2 revealed three distinct peaks at 284.8 eV, 286.3 eV, and 288.2 eV, attributed to C–C/C–H, C–O/C–N, and C = O bonds, respectively (Figure S3c). The O 1 s spectrum exhibited two peaks at 531.6 eV, 533.0 eV, corresponding to C=O, C–O bonds, respectively (Figure S3d). Notably, the detailed Cu 2p spectra of tCuinter-bCDs revealed peaks at 933.1 eV, 935.1 eV, 939.6 eV, 944.0 eV, and 948.2 eV, representing Cu 2p3 and Cu 2p3 Sat., indicating the coexistence of Cu+ and Cu2+, with contents of 58.58% and 41.42%, respectively (Fig. 1g). In contrast, the Cu 2p spectra of tCuinter-bCDs@-NH2 revealed peaks only at 935.2 eV, 942.1 eV, and 945.5 eV, indicating the presence of Cu2+ (Fig. 1h). Cu2+ can initiate ·OH production through a Fenton-like reaction. Nonetheless, the ratio of Cu2+ to Cu+ determines their activity and longevity, which can activate H2O2 to produce ROS due to the dual roles of H2O2 as a reductant and an oxidant [35, 36]. The conversion and recycling of valence states of multivalent metals are crucial in the production of ROS and the degradation of organic contaminants [37].
Finally, Inductively Coupled Plasma Mass Spectrometry (ICP-MS) was employed to determine the Cu concentrations in OAAs (Fig. 1i). The results indicated that conventional copper doping levels significantly exceeded those of trace internalized doping, with an average concentration 13.5 times greater than that of tCuinter-bCDs. Biomass-mediated internalized doping reduces the copper ion content in OAAs, likely due to the removal of extraneous copper ions during synthesis. Despite reduced doping, functional activity remains unaffected, while concurrently enhancing material biocompatibility and environmental friendliness.
OAAs with negative charges exhibit highly efficient antiviral activity in plant
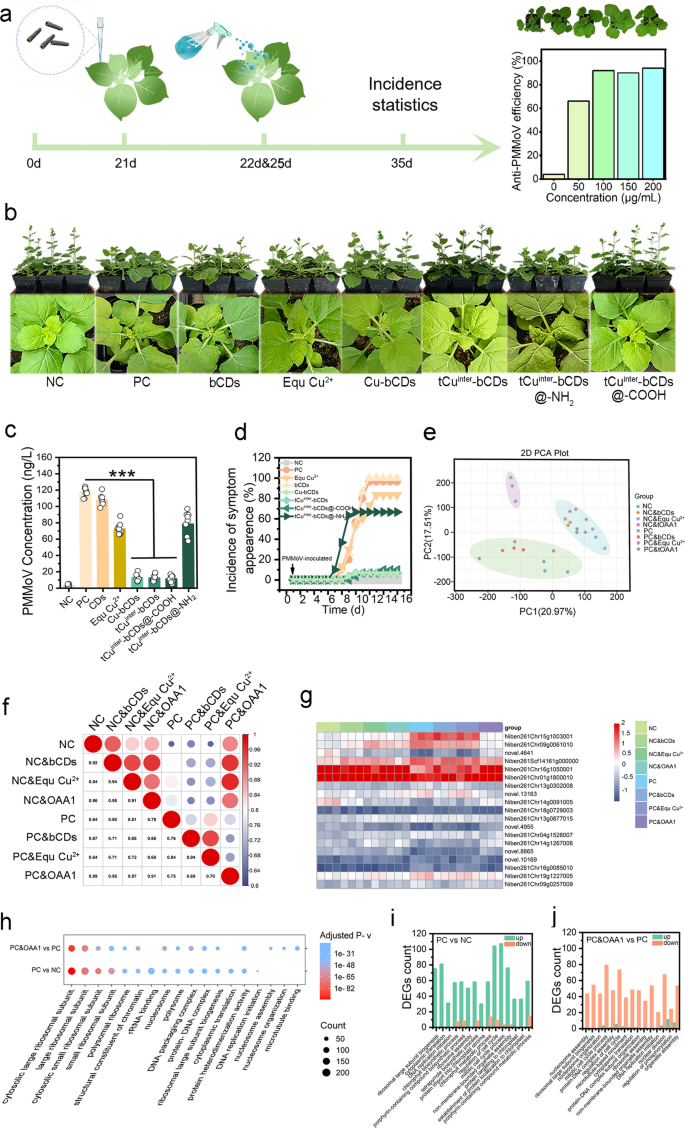
Based on the PMMoV pDNA vector, a tobacco infection model was established, and virus-exposed or unexposed leaves were treated with different concentrations of tCuinter-bCDs (Fig. 2a, Figure S6a–c), results showed that a concentration of 100 μg ml−1 was the best anti-plant virus regimen. At this concentration, the anti-plant virus efficiency of different OAA was verified (Fig. 2b), Antiviral efficacy was assessed by analyzing plant physiological and growth parameters and quantitatively evaluating virus levels through the detection of virus count and virus-related gene expression. Biomass analysis revealed that the negative control (NC), Cu-bCDs, tCuinter-bCDs, and tCuinter-bCDs@-COOH treatment groups displayed comparable masses (averaging 9.84–10.96 g), whereas the positive control (PC), bCDs, EquCu2+, and tCuinter-bCDs@-NH2 groups exhibited lower levels (averaging 6.65–7.28 g), with the former significantly higher than the latter (Figure S4a). Plant height and the number of leaves per plant (PCS) showed a similar trend, with the NC, Cu-bCDs, tCuinter-bCDs and tCuinter-bCDs@-COOH treatments resulting in heights of 2.21, 1.88, 1.97, and 2.01 times and PCS of 1.57, 1.48, 1.65, and 1.65 times those of the PC, respectively (Figures S4, S5). Statistical analysis of the incidence rate over time under PMMoV inoculation and OAAs exposure revealed symptom manifestation around the seventh day without effective OAA intervention, as evidenced by the results of the PC (Fig. 2c). EquCu2+ and tCuinter-bCDs@-NH2 displayed low efficiency in resisting PMMoV, with efficiencies of only 16.67% and 33.33%, respectively, followed by the Cu-bCDs, tCuinter-bCDs, and tCuinter-bCDs@-COOH exposure groups, with efficiencies of 93.33%, 93.33%, and 90%, respectively. To precisely quantify the accumulation level of virus particles in plant tissues, enzyme-linked immunosorbent assay (ELISA) was employed (Fig. 2d). The results indicated that Cu-bCDs, tCuinter-bCDs, and tCuinter-bCDs@-COOH treatments led to minimal virus exposure, reducing virus levels by 88.94%, 88.29%, and 84.20%, respectively, compared to PC. While EquCu2+ and tCuinter-bCDs@-NH2 exhibited a significant decrease in virus content compared to PC. This shows that when considered alongside physiological and growth parameters, they fell short of efficient virus prevention and control. TEM imaging of the virus in the plant tissue fluid from both the PC and tCuinter-bCDs treatment groups provided additional verification of the previously mentioned findings (Figure S7).
Depicts the analysis of antiviral activity in live plants against PMMoV using various materials. a The scheme illustrated the timeline of PMMoV inoculate and tCuinter-bCDs treatment. b Morphological changes and symptoms in Nicotiana benthamiana were o bserved post-inoculation with PMMoV (PC) and compared to non-inoculated controls (NC); photographs were taken at 36 days post-inoculation (dpi). c PMMoV content was determined via ELISA, with samples collected 16 days post-inoculation, including 3 biological and 3 technical replicates per treatment. d The kinetics of symptom development following PMMoV inoculation were statistically analyzed over a 16-day period, starting from the day of inoculation, with 30 plants per treatment. e PCA analysis of the DEGs. f Correlation analysis of the FPKM for DEGs in plants exposed to antiviral agents either inoculated with PMMoV or not. g Heatmap analysis of DEGs related to virus proliferation-induced protein expression and plant virus defense, annotated with GO-enriched terms for expression-related genes. h Comparison of the enriched GO terms between PC vs. NC and PC & OAA1 vs. PC, focusing on the top 15 significantly enriched terms. i, j Statistics of the upregulated and downregulated expression levels of DEGs among the top 15 significantly enriched GO terms in PC vs. NC and PC & OAA1 vs. PC.
PMMoV comprises ORF1 (126 kDa) with methyltransferase and helicase activity, and ORF2 (183 kDa) with RNA-dependent RNA polymerase activity. Together with the movement protein (MP, ORF3) and capsid protein (CP, ORF4), they constitute the structure of PMMoV. All four proteins are indispensable for PMMoV’s replication and assembly. To further assess the potential risk of virus proliferation, the expression levels of these four protein genes in leaves exposed to the control groups (NC, PC) and tCuinter-bCDs were examined using qPCR (Figures S8a–d, S9a–e). The results revealed the absence of ORF1, ORF2, and CP in both NC and tCuinter-bCDs, and MP showed minimal expression. However, its presence alone does not pose a threat to PMMoV’s assembly and proliferation. Based on these findings, the highly effective in vivo anti-PMMoV activity of Cu-bCDs, tCuinter-bCDs@-COOH, and tCuinter-bCDs was validated.
Following plant virus infection, the viral genetic material was integrated into the plant’s genome, promoting the expression of pathways related to plant protein synthesis to facilitate rapid proliferation [38, 39]. This process intensifies the plant’s metabolic burden, leading to growth aberrations such as leaf curling, reduced stature, and decreased biomass [40]. Our study comprehensively assessed both growth phenotypes and physiological parameters, revealing the remarkable efficacy of OAAs against PMMoV. Notably, tCuinter-bCDs@-NH2 and tCuinter-bCDs@-COOH displayed notable distinctions in vivo antiviral efficacy, likely stemming from differences in copper ions with distinct valence states; this is directly related to the induction efficiency of free radicals. Moreover, conventionally synthesized Cu-bCDs demonstrated comparable antiviral efficiency to tCuinter-bCDs but leached higher ambient copper levels. Consequently, due to their facile synthesis and eco-friendliness, further exploration into the anti-plant virus activity and mechanism of tCuinter-bCDs (OAA1) was carried out.
To validate the remarkable efficacy of OAA1 in enhancing photosynthesis, an analysis of the photosynthetic response efficiency to varying levels of CO2 (0–1800 μmol m−2 s−1) and light (0–1800 μmol m−2 s−1) was conducted (Figure S10a, b). Under stress from PMMoV infection, the photosynthetic capacity experienced a noticeable decline in the PC group in both response curves. Despite its known antiviral properties, EquCu2+ failed to fully restore photosynthetic efficiency to normal levels. Intriguingly, while initial stages of bCDs treatment did not exhibit clear antiviral effects, they remarkably preserved normal photosynthetic levels in PMMoV-infected plants. Meanwhile, the OAA1 treatment showcased dual functionality, effectively combating PMMoV while simultaneously enhancing photosynthesis, which may enhances photosynthetic efficiency mainly by functioning as an electron transport carrier, enhancing the efficiency of photonic-electronic conversion and thus improving photosynthetic efficiency. Examining the light response curve, a decline in photosynthetic efficiency under high light intensity was observed, potentially due to the phototoxic effects of bCDs fluorescence. Further assessments under natural conditions (CO2 400 μmol mol−1, PAR 1000 μmol−2 s−1) showed that PMMoV-infected plants treated with OAA1 exhibited noteworthy enhancements in net photosynthetic rate (Pn) (Figure S11a), stomatal conductance (Gs) (Figure S11c), and transpiration rate (E) (Figure S11d), with increases of 62.00%, 58.68%, and 53.47% respectively compared to PC, and the exposure to bCDs notably improved (17.53%) the Pn. Moreover, exposure to both bCDs and OAA1 significantly elevated chlorophyll levels (including chlorophyll a and b), while carotenoid levels remained unchanged.
(Figure S12a–d). The correlation between improved photosynthesis and nitrogen levels was further confirmed through total nitrogen content analysis (Figure S13).
Numerous studies have confirmed that salicylic acid (SA) and jasmonic acid (JA) are crucial secondary metabolites in combating plant viruses, with their biosynthesis intricately linked to chloroplasts [38, 41, 42]. Plant viruses disrupt hormone synthesis by targeting chloroplasts to facilitate infection [43], leading to symptoms such as leaf chlorosis and mottling. Cucumber mosaic virus (CMV), Tomato mosaic virus (ToMV) [44, 45], Rice stripe virus (RSV) [46], and Potato virus X (PVX) [47] have all demonstrated damage to the host photosynthetic systems. In this study, functional OAA1 and bCDs materials were utilized to mitigate the chlorophyll stress caused by plant viruses, thereby promoting the production of plant hormones with immune activity to effectively combat against viral infections.
Transcriptional analysis elucidates the molecular response of OAA1 against PMMoV
Transcriptomic analysis revealed the host response to plant viruses, demonstrating that plants have evolved complex defense mechanisms against viruses, including immune receptor signaling, RNA silencing, hormone-mediated defense pathways, and protein degradation [48]. Preliminary experiments have shown that OAA1 can effectively inhibit plant virus invasion and enhance photosynthesis. To elucidate the expression of related genes during the interaction between plant viruses and plants, transcriptomic analysis was conducted on tobacco leaves infected with PMMoV for 7 days and treated with different materials as controls. PCA clustering results indicated that the NC, without any treatment, was classified separately. Ineffective treatment groups for virus infection, such as PC, PC&bCDs, and PC&EquCu2+, clustered together. NC&bCDs, NC&EquCu2+, NC&OAA1, and PC&OAA1 also clustered together, indicating a healthy plant response to nanomaterials. Notably, PC&OAA1, as a treatment group for virus infection, clustered with this group, suggesting that the plant viruses were efficiently inhibited by OAA1 (Fig. 2e). PC generated a large number of differentially expressed genes (DEGs) compared to NC (Figure S14a). However, exposure to OAA1 significantly reduced the level of DEGs in PC, indicating the therapeutic effect of OAA1 against PMMoV (Figures S14b, c, S15). Correlation analysis of FPKM values showed that PC&OAA1 demonstrated strong correlations with NC, NC&bCDs, NC&EquCu2+, and NC&OAA1, yielding correlation coefficients of 0.89, 0.95, 0.97, and 0.91, respectively (Fig. 2f).
In the absence of PMMoV inoculation, exposure to bCDs and OAA1 significantly upregulates the expression of genes related to photosynthesis (Figure S16a, b). This finding aligns with the outcomes of prior studies on light and parameter detection. Among the top 15 GO enriched pathways for NC&bCDs vs. NC, 9 are associated with photosynthesis or the synthesis and metabolism of photosynthetic pigments, while for OAA1, there are 8 such pathways, with nearly all associated genes observed to be upregulated (Figure S17a, b). However, when inoculated with PMMoV, treatment with bCDs alone does not lead to significant enrichment of pathways related to photosynthesis, instead primarily enriching in antiviral secondary metabolites such as salicylic acid synthesis and metabolism, and antioxidant functions. Therefore, it is speculated that the composite doping of bCDs with copper exhibits dual functions in promoting photosynthesis and resistance to PMMoV.
Infection by plant viruses triggers the significantly upregulation of genes associated with ribosome assembly and protein synthesis (Fig. 2h), thereby accelerating the process of virus replication and assembly. Among the top 15 GO enriched terms for differentially expressed genes between the PC and NC groups, 14 are related to ribosome assembly and protein synthesis. Treatment with OAA1 leads to a noticeable downregulation in the expression of genes related to ribosome assembly and protein synthesis (Fig. 2i, j), with 13 out of the top 15 GO enriched terms for DEGs indicating protein transcription and ribosome assembly functions. These results further affirm the effective intervention of OAA1 in the replication and proliferation of PMMoV at the molecular biology level.
Kmeans clustering of DEGs produced eight distinct gene clusters, Classes 1–8, containing 5669, 6226, 6178, 5981, 5509, 6721, 7093, and 7640 DEGs, respectively (Figure S18). Cluster 3 primarily exhibited significant effects following exposure to bCDs and EquCu2+ after PMMoV infection. Clusters1, 2, 4, 5, and 6 were primarily influenced by both OAAs and PMMoV infection. Clusters 7 and 8 were mainly influenced by OAA1 exposure. Cluster 7 showed downregulation of gene expression induced by PMMoV infection, indicative of plant functional damage caused by PMMoV stress. However, exposure to OAA1 could reverse this effect, restoring gene expression to normal levels. Cluster 8 showed upregulation of gene expression induced by PMMoV infection, which may represent a cluster of defense genes induced by PMMoV. Exposure to OAA1 could induce these genes to return to normal levels, suggesting a virus defense function of OAA1.
Further gene expression analysis revealed that, compared to the NC group, NC&OAAs groups, and PC&OAA1, other PC&OAAs groups exhibited significantly elevated expression of antiviral defense mechanisms (Fig. 2g). Of the 19 genes associated with plant virus defense examined, 14 showed notable upregulation. Such upregulation is the most direct evidence of viral intrusion [49]. Both the PC&OAA1 and NC&OAAs groups maintained low expression levels similar to those of the NC group, thus confirming the antiviral efficacy of OAA1. The genes associated with photosynthesis were upregulated when exposed to OAAs (NC&bCDs, NC&OAA1, PC&bCDs, PC&OAA1) in comparison to NC (Figure S19). Additionally, analysis of 385 genes involved in protein transcription, translation, and ribosome assembly revealed a consistent expression pattern with those related to antiviral defense (Figure S20). PC, PC&bCDs, and PC&EquCu2+ displayed increased expression levels, with PC showing the most marked increase. Genes associated with ribosome assembly and protein expression in plants were significantly downregulated under OAA1 exposure, indicating a molecular response following viral clearance. Moreover, studies have shown that WUSCHEL inhibits viral protein synthesis by suppressing the expression of plant S-adenosyl-l-methionine-dependent methyltransferases involved in ribosomal RNA processing and ribosome stability [39]. Although their processes are opposite, they are sufficient to demonstrate the suppression of plant viruses within tissues. qRT-PCR analysis of selected genes (related to photosynthesis and protein expression) with stage-specific expression patterns further supports these findings, aligning with the transcriptomic results (Figure S21a, b).
OAA1 synergistically with exogenous H2O2 enable efficient degradation of CP and PMMoV
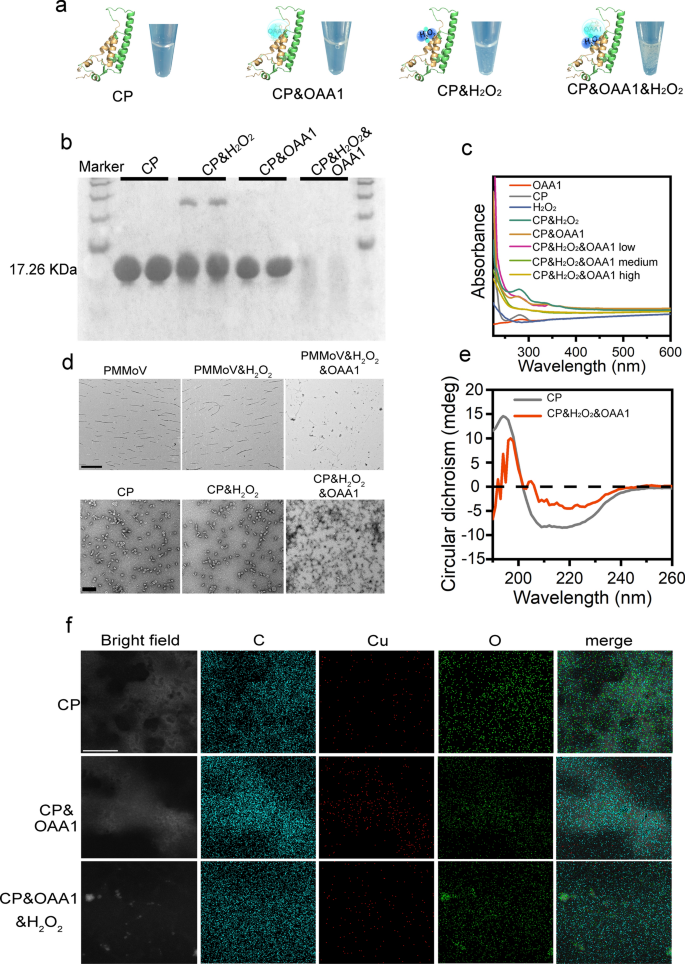
To validate the degradation mechanism of OAA1 against PMMoV, in vitro degradation experiments were conducted using purified coat protein (CP) expressed from plasmids and PMMoV isolated from plant purification. First, SDS-PAGE analysis (Figure S22) identified a 17.26 kDa CP in both infected plant tissue and purified expression products [50]. The degradation experiments confirmed the degradation of CP or PMMoV under various conditions, revealing a significant link between CP or PMMoV degradation and the incorporation of H2O2 (Fig. 3a, b, Figure S23). OAAs with a negative charge exhibited higher degradation efficiency compared to those with a positive charge, and the addition of H2O2 was crucial for activating this degradation (Figure S24). The degradation efficiency of CP was assessed at different ratios of OAA1 and H2O2. Results indicated that a low concentration of OAA1 and H2O2 could not completely break down CP aggregates, and degradation initiation occurred at ratios of OAA1 and H2O2 (30%) corresponding to 1 μl and 3 μl in a 100 μl CP solution, achieving optimal degradation efficiency when increased simultaneously to 5 μl (Figures S25, 26). Previous research has shown that pH and ion concentration significantly influence the self-assembly of rod-shaped virus proteins [51]. Therefore, degradation activity was verified across a pH range of 4–9. It was found that CP degradation was minimally affected only at pH 4, while degradation at other pH levels was nearly complete (Figure S27). No significant differences were observed in terms of ion concentration (NaCl 0.2–1 mM) (Figure S28).
Analysis of the degradation efficiency of OAA1 on CP. a The schematic illustration of CP inactivation by OAA1, H2O2 or OAA1/H2O2. bValidation of the conditions for OAA1 and H2O2 treatment on CP degradation was performed using SDS-PAGE protein gel electrophoresis. Each treatment was independently repeated twice, with an incubation time of 5 min. c UV–visible spectroscopic analysis of CP degradation, where low = 0.1 μl, medium = 5 μl, and high = 10 μl. d TEM images of PMMoV virus particles and CP degradation, PMMoV scale bar = 1 μm, CP scale bar = 100 nm. e Circular dichroism analysis of differences in CP secondary structure before and after degradation. f Co-localization analysis of characteristic elements C, Cu, and O before and after degradation with CP or residual degradation fragments, scale bar = 100 nm
UV spectroscopy analysis detected a significant absorption peak for CP at 280 nm [52], which notably diminished under the combined influence of OAA1 and H2O2, indicating effective degradation (Fig. 3c). Circular dichroism (CD) analysis revealed substantial alterations in CP’s secondary structure post-treatment [53] (Fig. 3e). The percentage of helices decreased from 99.50% to 85.30%, antiparallel structures marginally rose from 0 to 0.20%, parallel structures increased from 0.20% to 2.40%, beta-turns from 3.30% to 11.70%, and random coils from 0.30% to 2.00% (Table S1). TEM analysis of the degradation process for PMMoV and CP showed that OAA1, when combined with H2O2, effectively fragmented the virus particles and CP fragments (Fig. 3d). Overall, the results suggest that OAA1 facilitates virus disintegration by synergistically generating potent ROS with H2O2, specifically targeting the CP.
To provide clearer evidence, a visualization analysis of the element distribution of CP and its interaction with OAA1 throughout the degradation process was conducted (Fig. 3f). In purified PC, carbon and oxygen were uniformly distributed across the intact protein surface. Following the addition of OAA1, specific enrichment of C and Cu on the CP surface was observed, while oxygen remained uniformly distributed throughout the field of view, with no significant degradation of CP at this stage. The subsequent addition of trace amounts of H2O2 led to protein degradation into fragments. At this point, Cu became freely distributed after losing its CP target, and it is noteworthy that oxygen was heavily adsorbed on the residual protein fragments, speculated to be produced by ·OH and their involvement in the degradation reaction. The introduction of OAA1 confirmed the co-localization of C and Cu with CP, substantiating the specific binding affinity of OAA1 to CP and thereby its role in facilitating the efficient subsequent degradation of CP.
In a living plant model, the invasion of plant viruses induces stress responses, leading to a significant increase in ROS levels in infected tissues [54, 55]. However, the H2O2 produced (compared with the NC 5.58 times) by plants alone is insufficient to cause virus lysis, as confirmed by our experimental results (Figure S29a, b). Although previous studies have demonstrated that H2O2 serves as an excellent precursor for ·OH in animal diseases [56, 57], its application in plants has been less reported. ·OH, generated by the Fenton/Fenton-like reaction which relies on H2O2, is capable of inflicting severe damage on proteins and nucleic acids [58]. Conversely, the absence of H2O2 in healthy plant tissues indicates that OAA1 exhibits outstanding biocompatibility [59], ensuring they do not pose a threat to the proteins within these tissues.
The specific binding of OAA1 to CP induces degradation of neighboring segments
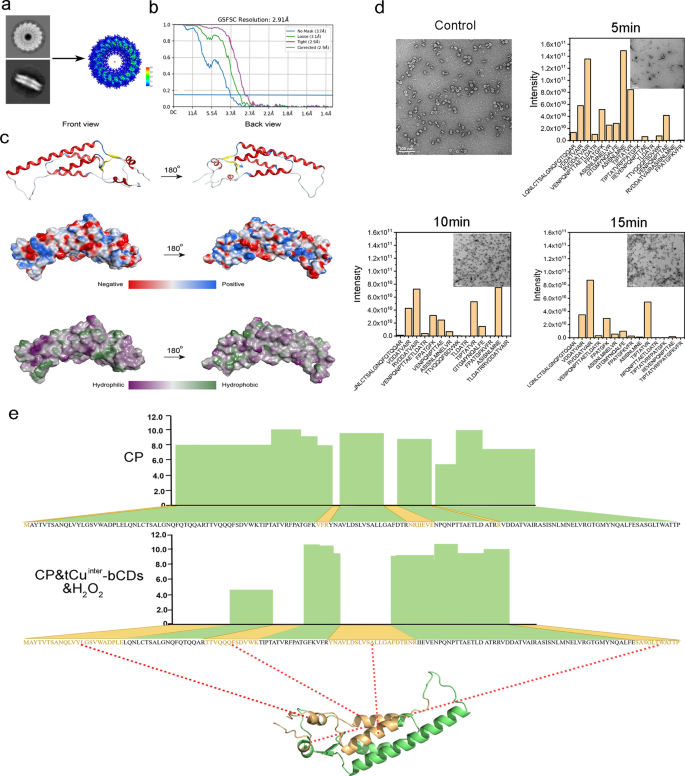
The crucial step in elucidating the degradation mechanism of CP by OAA1 was to acquire an accurate tertiary structure model of CP. For the first time, this study resolved the three-dimensional structure of PMMoV CP using cryo-electron microscopy, achieving a resolution of 2.91 Å with a B factor of − 63.8 Å (Fig. 4a–c, Figure S30). In vitro, the free CP assembles into disk-shaped structures, and our constructed self-assembled disk structure comprises 17 CP protein monomers, displaying C17 symmetry. Each CP measures 70.4 Å in length, 37.5 Å in width, and 26.3 Å in height (Figure S31), composed of four major helices and two minor helices, along with two distinct β folds (Fig. 4c). The cryo-electron microscopy structure exhibits variations when compared to its closely related tobacco mosaic virus (TMV) [60].
Construction of the CP degradation model. a Top and side views of CP cryo-EM images and construction of a high-resolution model. b Gold-standard Fourier shell correlation (FSC) indicates an overall resolution of 2.91 Å. c Three-dimensional structural model of the PMMoV CP monomer, distribution of three-dimensional electrostatic potential of CP, three-dimensional hydrophilicity/hydrophobicity distribution. d TEM images depicting the CP degradation of OAA1 at different time points and statistical analysis of peptide sequences in OAA1 samples exposed over various durations. e Specific degradation sites of OAA1 identified within the first 15 min. The analysis of the degradation process was performed using three independent replicate experiments
A time-dependent kinetic model was developed to investigate the interaction between OAA1 and CP. Amino acid sequencing analysis was conducted on samples taken after 5, 10, and 15 min of co-incubation of OAA1 and CP for degradation. After 15 min, in the full-length sequence of 157 amino acids, coverage in the control group reached 92.4%, while in the degradation treatment group, it averaged only 57.3% (Fig. 4e). The specific sequences that could not be detected were statistically identified as 1-MAYTVTSANQLVYLGSVWADPLE-23 43-TTVQQQFSDVWK-54, 73-YNAVLDSLVSALLGAFDTRNR-93, and 147-SASGLTWATTP-157, located respectively at both ends and the middle of the CP sequence. TEM imaging results of the degradation process depict a gradual breakdown over time, accompanied by a reduction in peptide sequence content as the incubation time progresses (Fig. 4d). Additionally, the abundance of most sequences exhibits a gradient variation with degradation time (Figure S32).
The incomplete coverage in the control group was attributed to the short sequences produced by protease hydrolysis, which were undetectable in the analysis [61, 62]. Conversely, the missing amino acid fragments in the treatment group were longer segments that remained undetectable due to material degradation [63, 64]. Previous studies have shown that chiral nanomaterials can degrade specific sequences of the CP of TMV through a hydrolysis process, potentially independent of the strong oxidative stress induced by free radicals [34]. However, our findings indicate that OAA1 exhibits sustainable degradation activity, suggesting that long-term exposure may lead to the complete degradation of all sequences. Nevertheless, it was observed that the degradation process initiates from specific sequences, as evidenced by the absence of only three sequences, 1-MAYTVTSANQLVYLGSVWADPLE-23, 73-YNAVLDSLVSALLGAFDTRNR-93, and 147-SASGLTWATTP-157, at both 5 and 10 min. By 15 min, the absence of the 43-TTVQQQFSDVWK-54 sequence had increased, along with a notable decrease in the abundance of peptide fragments. Thus, these degradation processes may eventually achieve completion over time.
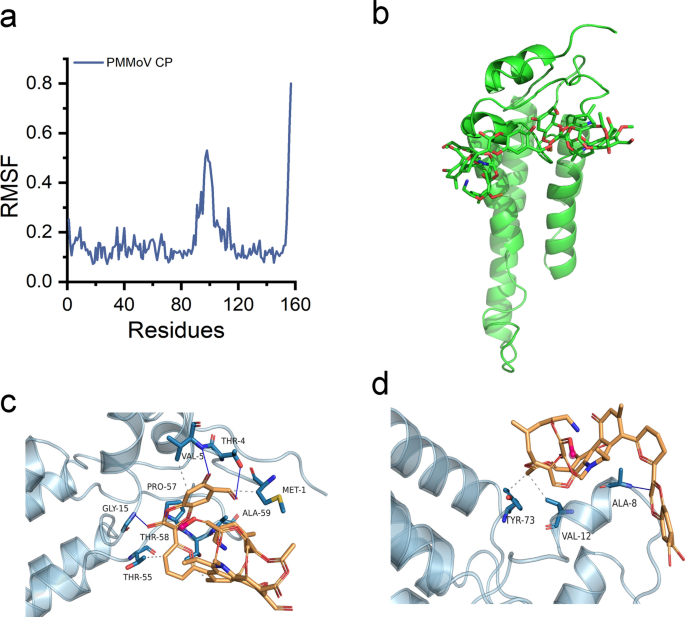
To explore the stability and kinetic characteristics of the OAA1/CP complex in aqueous solution, modeling of the composition and content of OAA1 elements was conducted, followed by subsequent optimization to derive a simplified unit model of OAA1 (Figure S33). The Root Mean Square Deviation (RMSD) of the system was examined, revealing rapid attainment of stability shortly after simulation initiation. Notably, the RMSD values of the protein exhibited minimal fluctuation throughout the simulation (Figure S34a). Concurrently, the radius of gyration (Rg) remained consistent (Figure S34b), indicating negligible alterations in the protein’s secondary structure throughout the simulation. Analysis of the solvent-accessible surface area (SASA) indicated a slight reduction from 0 to 600 ns in the protein-small molecule system (Figure S34c). Delving deeper into amino acid dynamics via Root Mean Square Fluctuation (RMSF) analysis, pronounced fluctuations were observed within residues 90–120, juxtaposed with minor oscillations in other regions, suggesting stabilization possibly facilitated by interactions with the OAA1 (Fig. 5a). Additionally, hydrogen bond calculations between the protein and small molecule revealed varying bond counts ranging from 0 to 6 over the simulation period (Figure S34d), underscoring the dynamic nature of their interaction.
Molecular dynamics simulation results and interaction mode schematic. a RMSF plot showing fluctuations of the complex during simulation. b Overall schematic representation. c, d Local analysis schematics. Proteins are illustrated in cartoon style, while small molecules are represented as sticks. Dashed lines indicate hydrophobic interactions, and solid blue lines indicate hydrogen bonds
Figure 5 provides a detailed depiction of the contact modes observed during the simulation process. It is illustrated that two small molecules adhere to specific regions of the protein, including the α-helix and loop regions (MET1 ~ GLU23) as well as central α-helix region (THR43 ~ LYS54) (Fig. 5b, Figure S35a). The majority of observed binding modes involve individual interactions between each material and the protein, as depicted in Fig. 5c, d. This delineation highlights the hydrophobic interactions established between the small molecule and protein residues MET1, VAL5, THR55, and THR58. Additionally, hydrogen bonds are formed with THR4, VAL5, GLY15, PRO57, and ALA59, with bond distances ranging from 0.329 nm to 0.306 nm (Fig. 5c). Figure 5d showcases the hydrophobic interaction between VAL12 and TYR73 (Figure S35c), accompanied by a hydrogen bond with ALA8 at a distance of 0.293 nm (Figure S35b). Consequently, the analysis suggests that the binding of OAA1 with CP primarily serves as an anchoring function, with the high biocompatibility of OAA1 material posing no disruption to the binding site of CP. Following binding, degradation of nearby sites is facilitated through the cooperative induction of hydroxyl radicals by H2O2.
When a nanomaterial enters a physiological environment, it rapidly adsorbs proteins, forming what is known as the protein ‘corona’ [65]. This study suggests that the small-sized OAA1 potentially interacts with the protein surface through an inverted model, i.e., adsorbing OAA1 onto the protein surface. Molecular dynamics simulations analysis indicates that OAA1 interacts with specific regions of the protein, namely sequences 1–23 and 43–54, via hydrogen bonding and hydrophobic interactions. However, sequences 73–93 and 147–157 do not exhibit direct contact with OAA1, but are still completely degraded. Hence, the degradation observed can be ascribed to the presence of free radicals in neighboring regions, notably ·OH, within the system.
Broad-spectrum activity of OAA1 against plant viruses
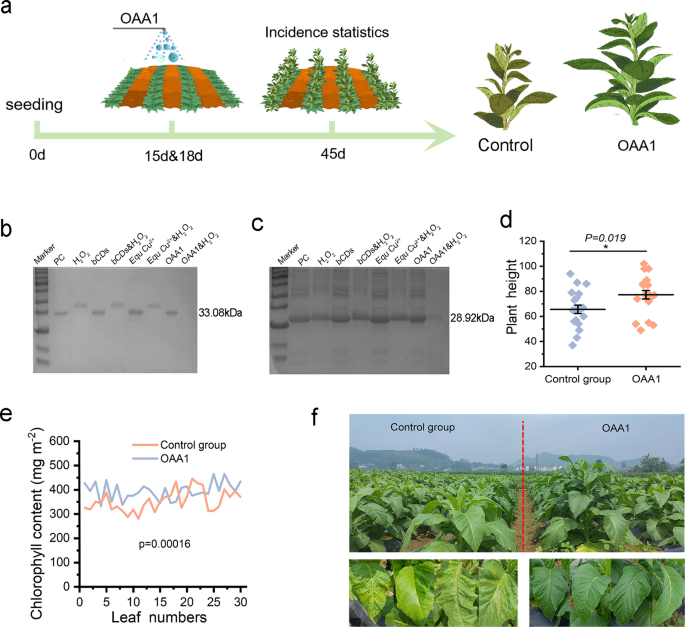
To further confirm the broad-spectrum degradation activity of OAA1, papaya ringspot virus (PRSV) (Fig. 6b) and tomato spotted wilt virus (TSWV) (Fig. 6c) were used for verification, the co-incubation of OAA1&H2O2 with viruses CP resulted in the complete degradation of CP. Under field conditions, the tobacco seedlings were sprayed with OAA1 15 and 18 days after planting, respectively. Due to the suitable climate and susceptible varieties, plant viruses infected rapidly and the leaves exhibit a range of pathological conditions in control (water) treatments (Fig. 6a, f, Figure S36). By contrast, the OAA1 exhibited the promoted effect on plant height and chlorophyll (Fig. 6d, e). These results indicate that OAA1 not only demonstrates exceptional CP degradation activity against PMMoV in laboratory settings but also exhibits significant inhibitory effects against a variety of unknown plant viruses in field experiments.
The broad-spectrum antiviral activity of OAA1. a The scheme illustrated the timeline of growth of field grown tobacco under OAA1 exposure (b) Degradation efficiency of PRSV CP following purification with OAA1. c Degradation efficiency of TSWV CP following purification with OAA1. d, e Response of chlorophyll content and plant height to OAA1 exposure in field experiments. f Growth phenotypes of the OAA1-exposed group and the control group in field conditions


