Characterization of coatings
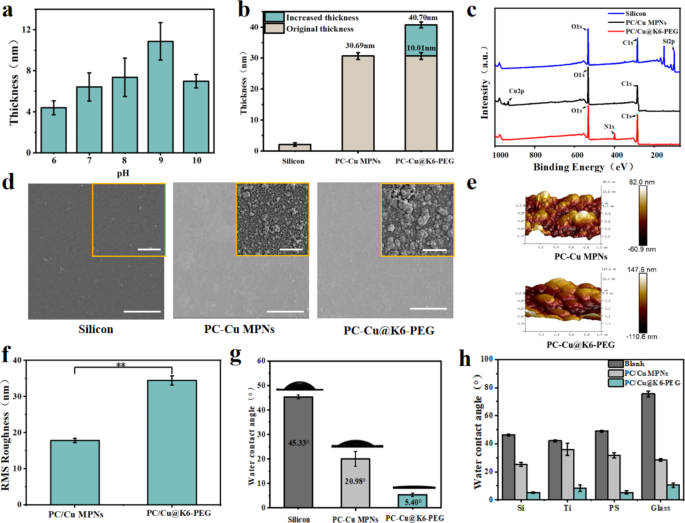
The PC-Cu MPNs coatings were prepared by self-assembly in the aqueous phase, as previously reported [31]. Subsequently, K6-PEG was deposited onto the MPNs coatings by immersing MPNs into K6-PEG solution (Fig. 1a). As illustrated in Fig. 2a, the thickness of deposited K6-PEG increased with the increased with the increase in pH of the K6-PEG solution before pH 9, then decreased at pH 9. The pH 9 was selected for the deposition of K6-PEG in the following experiments. At pH 9, the change in coating thickness from 30.69 ± 2.13 nm to 40.70 ± 2.52 nm was observed (Fig. 2b), suggesting an increase of about 10.1 nm after deposition of K6-PEG. In comparison to the PC-Cu MPNs coatings, N1s signals were observed on the PC-Cu@K6-PEG, whereas the nitrogen atoms in the coating are exclusively present in K6 (hexameric lysine), which provides compelling evidence for the successful deposition of K6-PEG (Fig. 2c). The proportion of nitrogen atoms in PC-Cu@K6-PEG was about 8.23%. In contrast, the proportion of Cu atoms in PC-Cu MPNs underwent a notable decline, from 1.98 to 0.19% (Table S1). These findings provide further evidence on the successful deposition of K6-PEG onto MPNs coatings. In order to visualize the morphological changes of the coatings, the coatings were deposited on silicon substrates and observed using a SEM. As illustrated in Fig. 2d, the surface of the PC-Cu MPNs coating appeared to be formed by the successive aggregation of numerous nanoparticles, while larger size was observed after the deposition of K6-PEG. In order to better understand the surface profile, the morphology and roughness of the PC-Cu MPNs and PC-Cu@K6-PEG coatings were examined by AFM. A wavy surface was observed, similar to the morphology observed by SEM, and it can be seen that the particles of the PC-Cu@K6-PEG coatings are larger than those of the PC-Cu MPNs coatings, and not only that, the surface of the PC-Cu@K6-PEG coatings is also wavy (Fig. 2e). In addition, compared to the PC-Cu MPNs coatings, the PC-Cu@K6-PEG coating exhibited a notable alteration in roughness, the root mean square (RMS) roughness increased from 17.84 ± 0.59 nm to 34.46 ± 1.25 nm (Fig. 2f), consistent with the findings by the SEM (Fig. 2d). The WCA was determined before and after K6-PEG deposition, due to the high sensitivity of WCA to surface variations. It was observed that the WCA of the uncoated silicon substrate was 45.33 ± 0.75 °, while the WCA of the surface with PC-Cu MPNs was 20.98 ± 2.98 °. The WCA was further reduced to 5.40 ± 0.2 ° in the following deposition of K6-PEG (Fig. 2g), which strongly supported the successfully deposition of K6-PEG. It is noteworthy that the extremely low WCA of PC-Cu@K6-PEG enables the formation of a robust hydration layer on the surface of the material, which in turn exhibits a high potential to resist biofouling. Furthermore, the coating’s ability to be assembled on a range of substrates, including silicon wafers, titanium, glass, and PS plastic, was demonstrated (Fig. 2h), to display the advantage for its wide application. The WCA before and after coating with PC-Cu MPNs or PC-Cu@K6-PEG was measured. The WCA of various substrates with the PC-Cu MPNs coating reduced to 20–30 °, and further significant reduction of the PC-Cu@K6-PEG coated surfaces were observed (< 10 ° and even < 5 ° for some substrates).
(a) The effect of pH value on the thickness of K6-PEG on PC-Cu MPNs was investigated (PC-Cu MPNs were immersed in K6-PEG (1 mg/ml) solution at pH 6, 7, 8, 9 and10 for 24 h); (b) The thickness of PC-Cu MPNs and PC-Cu@K6-PEG (PC-Cu MPNs immersed in K6-PEG (1 mg/ml) for 24 h, pH = 9); (c) XPS spectra of the blank silica substrate, PC-Cu MPNs and PC-Cu@K6-PEG; (d) SEM images of blank silicon substrates, PC-Cu MPNs coatings, and PC-Cu@K6-PEG coatings; (e) Surface morphology and (f) Root-mean-square roughness of PC-Cu MPNs and PC-Cu@K6-PEG coatings (measured by AFM); (g) Static WCAs of blank silicon substrates, PC-Cu MPNs, and PC-Cu@K6-PEG; (h) WCAs of silicon, titanium, glass and plastic substrates before and after PC-Cu MPNs and PC-Cu@K6-PEG coatings. The scale bars in (d) were 500 nm and 25 μm
Mechanical properties and hydrophilic ageing of coatings
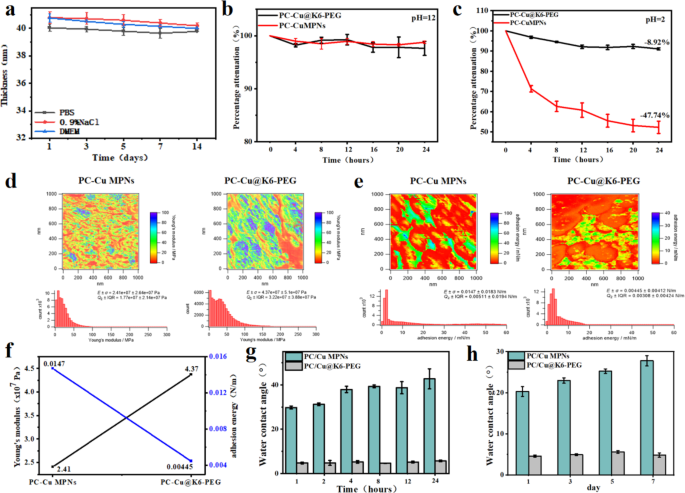
As an anti-biofouling coating on biomedical devices, it is essential that it maintains good stability under physiological conditions for an extended period of time. Therefore, changes in coating thickness over time were monitored by immersing the PC-Cu@K6-PEG coatings in PBS, 0.9% NaCl solution and cell culture medium DMEM (Fig. 3a). The results showed that there was no significant decrease in the thickness of the PC-Cu@K6-PEG coatings, suggesting that the PC-Cu@K6-PEG coating was stable in the above solution. It has been reported that MPNs lack long-term stability, especially under harsh environment, such as extreme acidic conditions [32], which has limited the application of MPNs. To test whether the introduction of K6-PEG could improve this property, the PC-Cu MPNs coatings and PC-Cu@K6-PEG coatings were subjected to immersion in NaOH (pH = 12) and HCl (pH = 2) solutions, respectively, for a period of 24 h. As illustrated, both the PC-Cu MPNs and PC-Cu@K6-PEG coatings demonstrated excellent stability in a pH = 12 NaOH solution (Fig. 3b). However, at pH 2, the thickness of the PC-Cu MPNs coatings decreased from the initial 30.5 ± 2.31 nm to 15.93 ± 3.05 nm (about 47.74% reduction) within 24 h, a continuous decreasing trend was observed over a 24 h period (Fig. 3c). The PC-Cu@K6-PEG coating exhibited a notable decrease in thickness from 30.5 ± 2.31 nm to 27.77 ± 0.52 nm (a reduction of about 8.92%) within the initial 12 h period, followed by a stabilization phase. These data demonstrated that the deposition of K6-PEG led to a significant enhancement in the acid resistance, compared to the PC-Cu MPNs coating. The Young’s modulus and adhesion energy of the coatings were determined by atomic force microscopy (AFM) prior to and following K6-PEG grafting. It can be observed that the Young’s modulus of PC-Cu MPNs is 2.41 × 10⁷ Pa, whereas following K6-PEG grafting, the Young’s modulus increases to 4.37 × 10⁷ Pa (Fig. 3d), representing a nearly twofold increase. Furthermore, low surface energy is intimately associated with the anti-biofouling capacity of the coating, and anti-biofouling coatings typically exhibit reduced surface adhesion energy [33,34,35]. As illustrated in Fig. 3e-f, the surface adhesion energy of the coating exhibited a notable decline from 0.0147 N/m to 0.00445 N/m following K6-PEG deposition. For superhydrophilic coatings, the ability to maintain superhydrophilicity over time is crucial for achieving effective anti-biofouling performance. In order to ascertain the impact of UV sterilization on biomedical applications, the coatings were subjected to UV irradiation. The results demonstrated that there was no notable alteration in the WCA on the coating surface following 24 h of UV irradiation (Fig. 3g). Additionally, no considerable change in the WCA on the coating surface was observed after the coating was immersed in PBS for 7 days (Fig. 3h). These findings suggest that the coating retains its initial superhydrophilicity, which is conducive to long-lasting antifouling performance.
(a) The effect of immersion time on the thickness of the material was investigated for two different solvents: phosphate buffered saline (PBS, 0.9% NaCl) and cell culture medium (DMEM); The ablation of PC-Cu MPNs and PC-Cu@K6-PEG coatings was observed following immersion in solutions with (b) pH = 12; (c) pH = 2; (d) Young’s modulus images of coatings in a liquid environment and gaussian distribution of the coated Young’s modulus; (e) Adhesion energy images of PC-Cu MPNs and PC-Cu@K6-PEG coatings in a liquid environment and gaussian distribution of the coating adhesion energy; (f) A comparison of the Young’s modulus and adhesion energy of PC-Cu MPNs and PC-Cu@K6-PEG coatings; (g) The WCAs of PC-Cu MPNs and PC-Cu@K6-PEG coatings after 1, 2, 4, 8, 12, and 24 h of UV irradiation; (h) The WCAs of PC-Cu MPNs and PC-Cu@K6-PEG coatings after 1, 3, 5, and 7 days of immersion in PBS
Depositing mechanism of K6-PEG
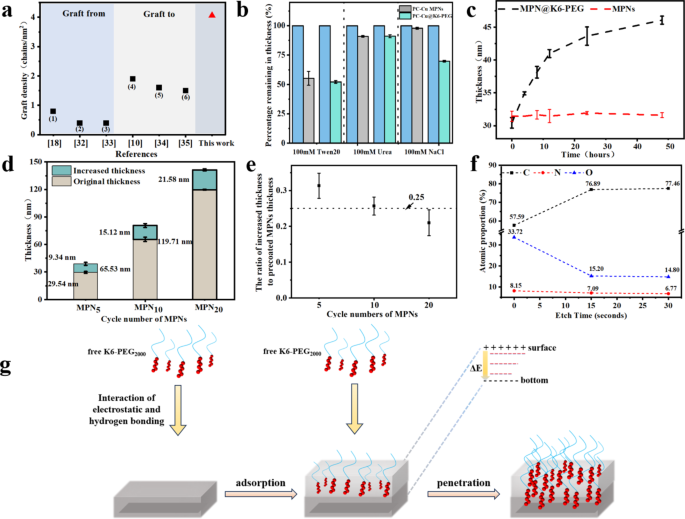
The fabrication of anti-biofouling polymer brushes represents the primary method of mitigating non-specific adhesion to medical device surfaces. The material composition and structural properties of polymer brushes are of significant relevance to the prevention of biofouling. One of the most crucial aspects is the grafting density of polymer brushes. It has been demonstrated that a high graft density enhance the structural stability, hydration strength (a stronger hydration layer), and resistance to bio-contamination of polymer brushes [36]. A comparison of the grafting densities of the polymer brushes obtained from the aforementioned methods and the present work was illustrated in Fig. 4a [37,38,39,40,41,42]. The maximum grafting density reported in other documents was 0.79 chains/nm² for GF strategy and 1.9 chains/nm² for GT strategy. In this work, the calculated graft density of K6-PEG on PC-Cu MPNs was found to be 4.06 chains/nm2. Given these observations, an investigation was undertaken into the adsorption mechanism of K6-PEG in MPN coatings with a view to elucidating the rationale behind the elevated graft density observed on the coating surface. By blocking one or more of these interactions, it is possible to compare the change in layer thickness of PC-Cu@K6-PEG with that of the MPNs control group, thereby enabling an investigation of the interaction between K6-PEG and MPNs. As illustrated in Fig. 4b, the coatings were immersed in 100 mM Tween 20 (shielded from hydrophobic interaction), 100 mM NaCl (shielded from electrostatic interaction), and 100 mM urea (shielded from hydrogen bonding interaction), respectively. There was essentially no reduction in MPNs in the NaCl solution. In contrast, the desorption rate of PC-Cu@K6-PEG was 30%, suggesting that the deposition process is primarily electrostatically driven. This result was consistent with the dependent deposition of K6-PEG on pH, which was a indication on electrostatic interaction [31]. Furthermore, the deposited thickness of K6-PEG on MPNs is strongly relied on the immersing time (Fig. 4c). It showed very slow depositing process with time, there was no plateau even after the tested 48 h. It was further found that the deposition process was also related to the thickness of the initial MPN. As illustrated in Fig. 4d, for the MPNs with different cycle numbers and thickness of 29.54 ± 1.10 nm, 65.53 ± 2.35 nm, and 119.71 ± 0.57 nm, the increased thicknesses were 9.34 ± 1.61 nm, 15.12 ± 2.09 nm, and 21.58 ± 1.19 nm, respectively, after soaking into K6-PEG solution at pH 9 for 24 h (Fig. 4d). The increased thicknesses attributed to K6-PEG deposition were obtained as 9.34 ± 1.61 nm, 15.12 ± 2.09 nm, and 21.58 ± 1.19 nm for the MPNs respectively. To better observe the contribution of precoated MPNs to the increased thickness, the increased thickness was normalized by the thickness of MPNs, and the data was showed in (Fig. 4e). It’s found that the ratio of increased thickness to the thickness of precoated MPNs was very close to 0.25, meaning per 100 nm precoated MPNs contributed to a 25 nm increase of K6-PEG coating.
(a) The graft density presented by GF (symbols of (1–3)) and GT (symbols of (4–6)) strategies in previous documents, and this work; (1) PEG brushes formed by surface-initiated aqueous-phase ATRP of methoxypolyethyleneglycol (750) acrylamide (MPEG350Am) monomers; (2) and (3) PEG brushes on silicon by surface initiated ATRP of oligo(ethylene glycol) methyl ether methacrylate (OEGMA300); (4) PEG layer immobilized on titanium by electrolytic reduction using o-quinone-linked PEG; (5) PEG brushes prepared by adsorption of thiol-ended PEG onto gold surfaces; (6) PEG brushes fixed onto magnetite surface by the coordinative interaction between carboxyl-terminated PEG and iron; (b) Percentage remaining of PC-Cu@K6-PEG coatings abated after immersion in 100 mM urea, Tween 20 and NaCl solutions; (c) The effect of immersing time into K6-PEG and (d) the cycle numbers of PC-Cu MPNs on the thickness of PC-Cu@K6-PEG; (e) The ratio of the increased thickness after K6-PEG deposition on MPNs with different cycle numbers to the thickness of the original MPNs; (f) Atomic ratios of PC-Cu PC-Cu@K6-PEG after different etch times (15 nm per etch depth with 15 s etching) measured by XPS; (g) Scheme of K6-PEG on the penetration process of PC-Cu MPNs
The elemental distribution of PC-Cu@K6-PEG at varying depths was subsequently examined through XPS etching. Specifically, the elemental distribution on the surface of PC-Cu@K6-PEG was initially analyzed by XPS. Subsequently, the layer was etched downward once (through a thickness of 15 nm) by XPS, maintaining the original position. Ultimately, the layer was etched downward once more, also through a thickness of 15 nm, by XPS. The results demonstrate that the surface of PC-Cu@K6-PEG films was comprised of 57.59% carbon (C), 8.15% nitrogen (N), and 33.72% oxygen (O) atoms, respectively. Following the initial 15 s of etching, a decrease in the percentage of detected N and O atoms was observed, while the percentage of detected C atoms increased. Following an additional 15 s of etching, the percentage of C, N, and O atoms in the film remained at 76.89%, 7.09%, and 15.20%, respectively (Fig. 4f). As the etching process continues, the proportions of C, N, and O atoms tend to stabilize, with the atomic proportion of the N element remaining at 6.77%. These results strongly indicated that the deposition of K6-PEG occurred not only on the surface but also within the MPN. The deposition process of K6-PEG is proposed in Fig. 4g. Initially, the free K6-PEG in solution is attracted to the MPN by electrostatic and hydrogen bonding interactions, resulting in the adsorption of K6-PEG on the MPN. The positive charge of K6 changed the zeta potential on the MPN surface, thereby creating an electrostatic potential energy difference (ΔE) between the top and bottom of the MPN. In the presence of this negative electric field, the positively charged K6 is further attracted deeper into the MPN until a even distribution of K6-PEG throughout the MPN layer is achieved.
Passivated protein-adsorption properties
Contact of the interventional catheter with blood results in the rapid adsorption of plasma proteins (especially fibrinogen) to the surface of the material, which then undergoes a conceptual transformation to form fibrin. The adsorption and denaturation of proteins can give rise to a number of complications, including acute thrombosis, acute inflammation, and a reduction or loss of the biological function of the surface. Consequently, it is of paramount importance to assess the adsorption properties of proteins on the surface of implant materials [43].
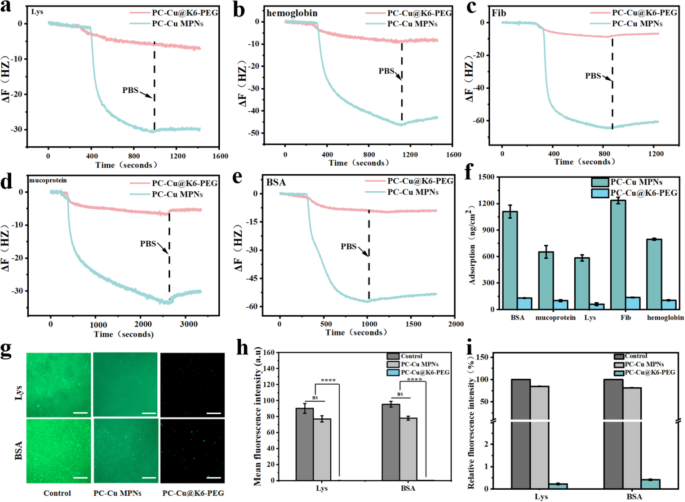
The non-fouling properties of hydrophilic materials are closely related to the hydration layer near the surface. This tightly bound water layer forms a physical and energetic barrier that prevents protein adsorption to the surface [44, 45]. In order to determine the dynamic passivation adsorption capacity of the coatings for different proteins, a series of tests were carried out using a quartz crystal microbalance (Q-CMD) to assess the adsorption of PC-Cu MPNs and PC-Cu@K6-PEG coatings for a range of proteins. Proteins with disparate physicochemical properties (including molecular weight (Mw) and isoelectric point (IP)) were selected for investigation (BSA has a molecular weight of 68 KD and IP 4.8; Lys has a molecular weight of 14–15 KD and IP 10.5–11.0; fibrinogen has a molecular weight of 330–340 KD and an IP 5.5; haemoglobin has a molecular weight of 67 KD and IP 4.5-5.0; and mucin has a molecular weight of 110 KD and IP 3.0–5.0). Specifically, 1 mg/ml BSA, Lys, fibrinogen, haemoglobin and mucin were dissolved in 1X PBS (pH = 7.4), the gold coated sensor was mounted in a Q-CMD chamber, the peristaltic pump speed was 90 rpm and the system temperature was set at 25 ℃ PBS was then passed through until the curves became smoother and then the PBS was changed to the protein solutions above. As illustrated in Fig. 5a-e, the time-dependent resonance frequencies on the gold sensor surface demonstrated that proteins were adsorbed by flowing on the material surface. In comparison to the PC-Cu MPNs group, the PC-Cu@K6-PEG coating group exhibited a significantly reduced change in frequency (6–9 times lower). In addition, the mass of proteins adsorbed on the surface of the gold sensor was calculated using the equation under the viscoelastic model, and the blank control group adsorbed the most amount of proteins on the surface up to 1,235.32 ng/cm2, while the amount of proteins adsorbed on the PC-Cu@K6-PEG was significantly reduced down to a minimum of 4.09 ng/cm2 (Fig. 5f), and the anti-adsorption efficiency against proteins was 99.67%. These results indicate that the PC-Cu@K6-PEG coating has good antiadsorption properties for proteins with a wide spectral range.
In QCM-D, the plots of time-dependent resonance frequencies after the adsorption of (a) Lys, (b) hemoglobia, (c) Fib, (d) mucoprotein and (e) BSA on PC-Cu MPNs and PC-Cu@K6-PEG coatings; (f) The quantity of the above adsorbed proteins on the PC-Cu MPNs and PC-Cu@K6-PEG coatings determined by Equations under the viscoelastic model; (g) Confocal images of FITC-BSA and FITC-Lys adsorbed on glass (control) the PC-Cu MPNs and PC-Cu@K6-PEG coatings; (h) The mean fluorescent intensity and (i) relative fluorescent intensity of adsorbed FITC-BSA and FITC-Lys on glass (control) the PC-Cu MPNs and PC-Cu@K6-PEG coatings, as obtained from (g). The scale bars in (g) were 20 μm. (N = 3, no significance noted as “ns”, *p < 0.05, **p < 0.01, ***p < 0.001 using t-test.)
Furthermore, in order to more effectively illustrate the coating’s capacity to resist protein adsorption, the samples were incubated with 1 mg/mL of fluorescein isothiocyanate-labeled bovine serum proteins (FITC-BSA) and lysozyme (FITC-Lys) for a period of 24 h. This allowed for a qualitative and semi-quantitative examination of the static adsorption behaviours of proteins on the surface of the materials. As shown in Fig. 5g, a large amount of fluorescent protein adsorbed on the blank glass slice (control), resulting in high surface fluorescence intensity. In contrast, there was slight decrease fluorescent signal on the PC-Cu MPN coatings and almost no visible fluorescent signal on PC-Cu@K6-PEG coating. From the quantitative analysis in the mean fluorescence (Fig. 5h), the amount of fluorescence adsorbed on the surface of the PC-Cu@K6-PEG coating was significantly reduced, with a fluorescence intensity of 0.5 a.u, which was reduced by a factor of ∼ 150 compared to that of the PC-Cu MPNs and by a factor of ∼ 200 compared to the blank glass (control). Figure 5i illustrated the relative fluorescence intensities by normalizing the samples’ intensity with the control’s, in which a reduced relative fluorescence intensity on PC-Cu MPN coating and significant reduction on PC-Cu@K6-PEG coating was observed. These results suggested that the coating had a strong passivation effect on protein adsorption.
Reduction in bacterial adhesion behaviour
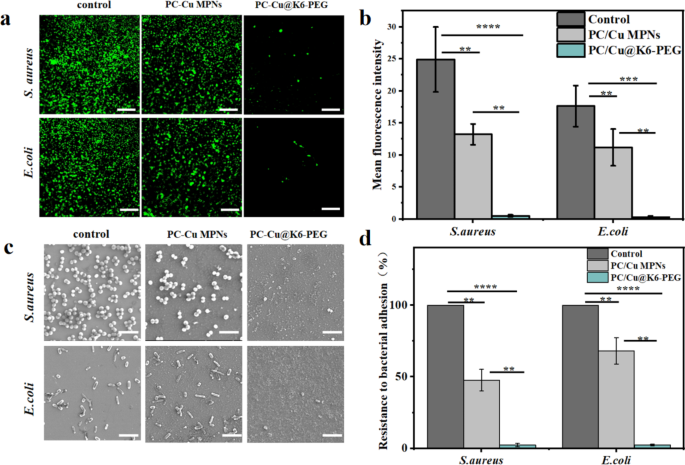
Previous studies have demonstrated that a significant proportion of bacteria contain a variety of protein appendages that play a direct or indirect role in adhesion [46], such as flagella, hyphae, and coils [47,48,49]. Bacterial adhesion is typically divided into three stages, commencing with reversible initial adhesion. This is followed by a transition to enhanced irreversible adhesion, and finally the development of a mature biofilm [50, 51]. Consequently, the inhibition of initial bacterial adhesion represents a pivotal strategy for the prevention of biofilm formation. The initial 8 h following bacterial contact with the surface is regarded as the “decisive period” for the prevention of bacterial adhesion. Consequently, the samples were incubated with Staphylococcus aureus (S. aureus) and Escherichia coli (E. coli) for 8 h in order to investigate their resistance to bacteria. Following an eight hours incubation period, the bacteria were stained with a LIVE/DEAD BacLight bacterial viability kit (Steps provided by supplier) and observed under a fluorescence microscope (Fig. 6a). It was observed that severe E. coli and S. aureus adhesion occurred on blank glass slice group (control) and the PC-Cu MPNs group. In contrast, only a few E. coli and S. aureus adhesion were observed on the surface of the PC-Cu@K6-PEG sample. A semi-quantitative fluorescence analysis (Fig. 6b) showed that the fluorescence intensity of the PC-Cu MPNs group was slightly reduced (by about two-fold) compared to the blank glass slides, whereas the average fluorescence intensity of the PC-Cu@K6-PEG group was reduced by about 50 folds compared to that of the blank glass slides group, and by about 25 folds compared to that of the PC-Cu MPNs. To provide a more visual representation of the coating’s resistance to bacterial adhesion, the incubated bacteria were dehydrated and cured, and then observed for bacterial adhesion on the sample surface by SEM. As illustrated in Fig. 6c, a considerable number of bacteria adhered to the wafer substrate (control group). In contrast, the number of bacteria on the surface of PC-Cu MPNs was relatively reduced, while a significant reduction in bacterial adherence was observed on the surface of PC-Cu@K6-PEG. Furthermore, the quantitative analysis results (Fig. 6d) demonstrated the number of bacterial adhesions was slightly reduced in the PC-Cu MPNs group compared to the control (by about twofold), whereas the number of bacterial adhesions on the PC-Cu@K6-PEG group was reduced by about 100 folds compared to the control group and by about 50 folds compared to the PC-Cu MPNs. The results were attributed to the strong hydrophilicity of PEG in PC-Cu@K6-PEG, which formed a tenacious hydration layer that could strongly repel bacteria when they approached the surface for adhesion [52]. Furthermore, Tanaka et al. [53] proposed the “intermediate water concept” to elucidate the water-mediated repulsion. This concept posits that the physical barrier of intermediate water plays a pivotal role in preventing the adsorption of proteins onto the substrate [50]. The dense intermediate hydration layer formed by the high density of PEG chains on the surface of the coatings successfully prevented the adhesion of bacteria and proteins on the surface. Together, these results demonstrate that the surface-modified PC-Cu@K6-PEG coatings are highly resistant to the adhesion of proteins and bacteria.
(a) Laser confocal imaging of live-dead-stained S.aureus and E.coli colonized on blank substrates, PC-Cu MPNs coating and PC-Cu@K6-PEG coating; (b) fluorescence semi-quantitative results for them; (c) The colonization behavior of Staphylococcus aureus and Escherichia coli on blank substrates, PC-Cu MPNs coatings, and PC-Cu@K6-PEG coatings; (d) the counting of their numbers were observed by SEM. The data was statistically derived from the number of bacteria adhering to the surface of the sample (n = 3). The scale bars in (a) were 5 μm and in (c) were 2 μm. (N = 3, no significance noted as “ns”, *p < 0.05, **p < 0.01, ***p < 0.001 using t-test.)
Hemolysis and antiplatelet adhesion
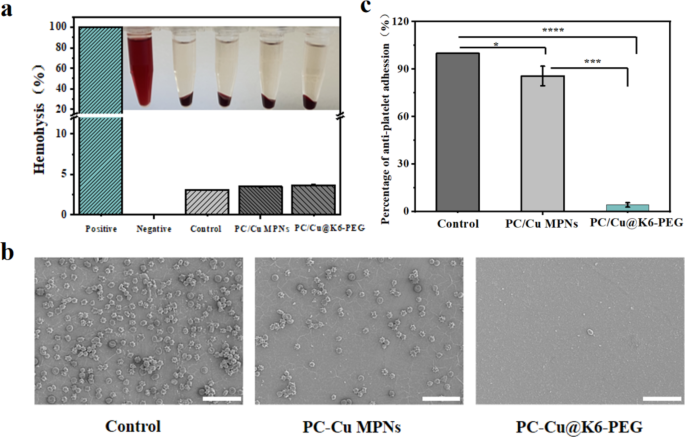
One of the most crucial criteria for the successful application of blood-contacting materials and devices is their blood compatibility. This is primarily assessed through in vitro analyses that examine the adhesion of blood cells and the formation of blood clots [54,55,56]. The Triton X-100 and 0.9% NaCl solution were employed as the positive and negative controls, respectively. Following incubation with erythrocytes at 37 °C for 4 h (Fig. 7a), the hemolysis rate was found to be less than 5% for both the PC-Cu MPNs coating and the PC-Cu@K6-PEG coating. This indicates that the coatings have a low hemolytic potential. It is well established that platelet adhesion to the surface of biomaterials can trigger blood coagulation and thrombosis [51, 57], The degree of platelet deformation and the amount of platelet adhesion are commonly employed as indicators of hemocompatibility in biomaterials [58, 59]. To assess the resistance of samples to platelet adhesion, platelet adhesion tests were carried out using SEM to observe their morphology as well as quantitative analysis by counting the number of adherent platelets. As shown in Fig. 7b, there was a significant difference in the degree of platelet adhesion on the surface of the different samples, with A large number of platelets adhered to the blank silicon substrate (control) (approximately 30,000/cm2), and a relatively small number of platelets (approximately 10,000/cm2) adhered to the PC-Cu MPN surface. In contrast, the presence of K6-PEG enabled the coating to effectively inhibit platelet adhesion and aggregation with a value of less than 50 /cm2, and the reduction of platelet adhesion was about 99.84%. Normalised to the number of platelets adhering to the surface of the control samples in Fig. 7b, as shown in Fig. 7c, we can see that the number of platelets adhering to the surface of the PC-Cu MPNs coatings differs from that of the control group by only one star, while the PC-Cu@K6-PEG group shows a significantly smaller difference than the latter group. These data suggest PC-Cu@K6-PEG coating exhibited considerable antithrombotic potential.
(a) Hemolysis test of red blood cells of blank silicon substrate, PC-Cu MPNs and PC-Cu@K6-PEG coatings; (b) SEM images of platelets adhering to bare and modified polyurethane. (c) Platelet adhesion rate normalised to the number of platelets in the control group in figure b. The scale bars in (b) were 20 μm. (N = 3, no significance noted as “ns”, *p < 0.05, **p < 0.01, ***p < 0.001 using t-test.)
In addition, in order to illustrate more the performance of PEG brushes with high graft density in anti-biofouling, the results of this study were compared with those of other studies (Table S2). It can be seen that in the GT’s strategy, the highest graft density PEG brushes achieved 98.93% anti-sorption of bovine serum proteins and 99% anti-adhesion of platelets. In the strategy of GF, the PEG brush with the highest graft density achieved 90% antisorption of human serum proteins and more than 99.5% antiadhesion to platelets. In the present study, antisorption of lysozyme, bovine serum proteins, fibrinogen, mucin, and hemoglobin were studied, with a maximum antisorption effect of 99.7% and an antimutagenic effect of more than 99.8% on platelets (see Table S2 for more comparisons).
Ex vivo antithrombogenic properties
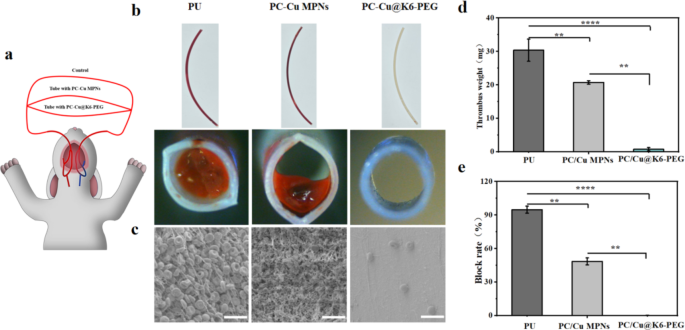
In order to further simulate clinical applications, in vitro catheter blood circulation experiments were conducted [60]. Rabbit arteriovenous shunt circuits were connected using commercially available medical polyurethane catheters with different surface treatments. (Fig. 8a) Following 2 h of ex vivo flow circulation without any systemic heparin anticoagulation, thrombus formation was found to be slightly reduced in the PC-Cu MPNs group in comparison with the catheter without coatings (Fig. 8b). Almost no obvious thrombus formation was observed in the PC-Cu@K6-PEG group. SEM analysis additionally demonstrated that the grafting of K6-PEG effectively inhibited thrombus formation (Fig. 8c). The blood-contact surfaces of bare PU and PU-MPNs tubes showed severe thrombosis with properties of densely interconnected polymerized fibrin networks, red blood cells, and activated platelets, in the PU-PC-Cu@K6-PEG group, only a very small number of haemocytes were seen on the surface (Fig. 8c). Quantitative analysis of these results further showed that thrombosis was significantly reduced in the PC-Cu@K6-PEG group compared to the other groups, as evidenced by the assessment of thrombus weight, occlusion rate (Fig. 8d-e). Specifically, PC-Cu@K6-PEG showed an approximately 30 folds and 21 folds reduction in mean clot weight compared with the PU tubing group and the PC-Cu MPNs group, respectively (Fig. 8d) Furthermore, the catheter occlusion rate was quantified by calculating the percentage of lumen area occlusion using computerised image analysis (Fig. 8e). The PC-Cu@K6-PEG modified catheters exhibited a significant reduction in thrombus occlusion rate compared to the PU tube group and PC-Cu MPNs group, with an occlusion rate of approximately 5%. These results clearly demonstrated that the K6-PEG modification imparts excellent anti-thrombotic properties to the material surface.
(a) Schematic illustration of arteriovenous (AV) shunt model connected to the rabbit; (b) Photographs of side (top) and cross-section (bottom) view of the bare and modified PU tubes after blood circulation; (c) Lumen surface morphology of each sample after blood circulation characterized by SEM; (d) thrombus quality; (e) catheter masking ratio.The scale bars in (c) were 20 μm. (N = 3, no significance noted as “ns”, *p < 0.05, **p < 0.01, ***p < 0.001 using t-test.)
The two main factors involved in thrombosis on blood contact implants are fibrinogen (Fib) adsorption and activation and platelet adhesion and activation [61]. Preliminary experiments confirmed the anti-absorptive capacity of the K6-PEG-modified surface against a wide range of proteins (including Fib, hemoglobia, etc.), as well as its resistance to platelet adhesion, suggesting a potential anti-thrombotic capacity. This was subsequently confirmed by the results of in vitro blood circulation experiments in rabbits. Therefore, the PC-Cu@K6-PEG coating has good prospects for use in medical antithrombotic catheters.


