Enrichment of the NF-κB Pathway in Both Tumor Epithelial and CAFs and Positive Correlation with the Disease Progression
We integrated two single-cell RNA sequencing datasets of high-grade serous ovarian cancer from the GEO database (GSE235329 and GSE184880). A total of 80,850 cells were clustered for further bioinformatics analysis after low-quality cells were removed, normalized, dimensionality reduced, and integrated. We identified 20,455 fibroblasts, which clustered into five subclusters, comprising one of the normal fibroblasts (NFs) and four of CAFs (Figure S1A, B). Initially, we compared genes between the NF and CAFs from the four clusters to explore their functions. PROGENy enrichment analysis revealed significant enrichment of JAK-STAT, PI3K, VEGF, hypoxia signaling, NF-κB, TNFa, EGFR, and MAPK pathways for each CAF cluster (Figure S1C). Similarly, we performed PROGENy enrichment analysis of differential genes between normal and malignant ovarian epithelium. VEGF, NF-κB, and TNFa pathways were significantly enriched (Figure S1D). The NF-κB pathway plays a vital role in the TME, promoting tumor cell progression, influencing CAFs to regulate matrix reorganization and cytokine secretion, and regulating the expression of immunosuppressive molecules [31, 42]. Activation of the NF-κB pathway triggers tumors to generate downstream responses, such as apoptotic escape and TME remodeling, leading to tumor insensitivity to platinum-based chemotherapeutic agents [43]. p65 plays a key role in the NF-κB pathway and is a major transcription factor in the NF-κB pathway, regulating the transcription of a wide range of genes. The EOC survival curves plotted using the Kaplan–Meier plotter revealed a negative correlation of high p65 expression with overall survival (Figure S1E). Collectively, our findings suggest that the NF-κB pathway is significantly upregulated in tumor epithelial cells and CAFs and plays an important role in TME regulation, making it a potential therapeutic target.
Characterization of PH20/CCM@PMCS
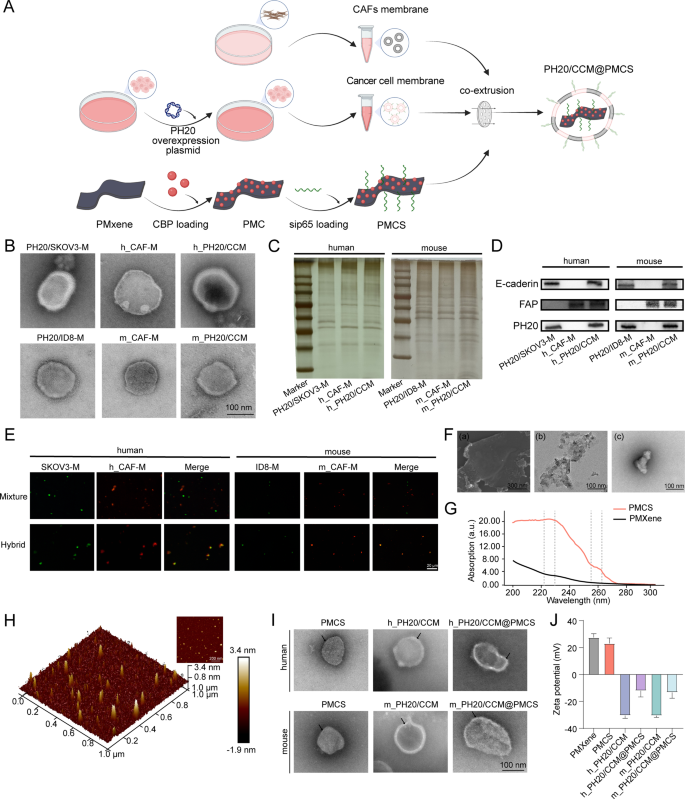
Figure 1A illustrates the preparation of PH20/CCM@PMCS in the following steps: (a) extraction of PH20-overexpressing tumor cell membranes and CAF membranes to form PH20/CCM; (b) MXene modification using PDDA to obtain the PMXene and enriching CBP and siRNA on the surface of PMXene to construct PMCS; (c) fusing PH20/CCM on the surface of PMCS via extrusion.
The PH20-overexpressing SKOV3 (PH20/SKOV3) membrane vesicles, human-derived CAF (h_CAF) membrane vesicles and human-derived PH20/CCM membrane vesicles (h_PH20/CCM) were obtained by extruding the extracted PH20/SKOV3 membranes, h_CAF membranes, and PH20/SKOV3 and h_CAF membranes, respectively. Furthermore, the PH20-overexpressing ID8 (PH20/ID8) membrane vesicles, mouse-derived CAF (m_CAF) membrane vesicles and mouse-derived PH20/CCM membrane vesicles (m_PH20/CCM) were obtained by extruding the extracted PH20/ID8 membranes, m_CAF membranes, and PH20/ID8 and m_CAF membranes, respectively. Transmission electron microscopy (TEM) images revealed a dark–bright–dark cell membrane structure of the vesicles with 10–20 nm thickness (Fig. 1B), consistent with a previous study [44]. The cell membrane vesicles exhibited a negative zeta potential (Figure S2), with no significant differences in appearance from different cell sources. We further evaluated the protein features of the CAF membrane vesicles, PH20-overexpressing cancer cell membrane vesicles, and PH20/CCM using SDS–PAGE. The proteins on the hybrid membrane vesicles shared common characteristics with the PH20-overexpressing cancer cell membrane vesicles and CAF membrane vesicles (Fig. 1C). Western blotting revealed the presence of specific proteins on the PH20-overexpressing cancer cell membrane vesicles, CAF membrane vesicles, and PH20/CCM, including E-cadherin, fibroblast activation protein alpha (FAP), and PH20 (Fig. 1D). This indicated that the functionalized membrane proteins were retained in the membrane vesicles and co-expressed on the hybrid membrane vesicles after membrane hybridization. To verify that the two cell membranes were fused through co-extrusion and not simple mixing, the tumor cell membranes were labeled with DIO (green), and the CAF membranes were labeled with DID (red). The tumor cell (green) and CAF membranes (red) did not overlap in the mixing group, but overlapped in the co-extrusion group (Fig. 1E), indicating a successful membrane hybridization after co-extrusion.
A high degree of dispersibility and nanoscale planar size are essential for MXene nanosheets to meet the stringent biomedical application requirements. MXene is shown in stacked blocks in scanning electron microscope (SEM) and TEM images (Fig. 1F(a) and 1F(b)), whereas further sonication reveals highly dispersed MXene in TEM images (Fig. 1F(c)). Subsequently, PMXene, PMXene@CBP (PMC), PMXene@sip65 (PMS), and PMCS were successfully synthesized. CBP and siRNA adhered to the surface of PMXene through electrostatic adsorption, and their loading efficiency and loading contents were calculated (Figure S3). Considering the entrapment efficiency and drug loading contents, we ultimately chose to synthesize PMCS in a ratio of CBP: PMXene: siRNA = 30:10:0.25. Among them, the entrapment efficiency of CBP was 82.98%, the drug loading content was 71.34%; the entrapment efficiency of siRNA was 71.79%, and the drug loading content was 1.75%. The ultraviolet-visible absorption spectra were used to analyze the main components of the PMCS. As shown in Fig. 1G, PMCS exhibited a strong absorption peak near 229 and 260 nm, corresponding to the binding of CBP and siRNA to PMXene, respectively. For drug release (Figure S4), CBP initially showed explosive release within the first 16 h and reached a plateau after 24 h. CBP exhibited a higher release rate at pH 5.0 than at pH 7.4, with approximately 70% drug release. The release of siRNA also followed this pattern, with a drug release rate of approximately 50% at pH 5.0. These findings indicated the excellent performance of PMXene as a nanocarrier for loading and delivering CBP and siRNA. Images of the nanoparticles were obtained using an atomic force microscope (AFM). The AFM image revealed a layered structure of PMCS with a maximum diameter of approximately 100 nm and a thickness of 4–5 nm (Fig. 1H). PMCS was then encapsulated using hybrid membrane vesicles. TEM images showed a layered morphology of PMCS with excellent monodispersity. PH20/CCM@PMCS exhibited a core-shell structure with a dark–bright–dark cell membrane structure observed on the surface, indicating the successful modification using the hybrid membrane (Fig. 1I). The overall size distribution of PH20/CCM@PMCS detected using dynamic light scattering (DLS) was approximately 110 nm, indicating uniform particle size of PH20/CCM@PMCS (Figure S5). The zeta potentials of PMCS, m_PH20/CCM@PMCS, and h_PH20/CCM@PMCS were (23.1 ± 4.1) mV, (− 12.1 ± 4.5) mV, and (− 13.3 ± 4.3) mV, respectively (Fig. 1J). The surface of the PH20/CCM@PMCS was negatively charged, which was beneficial for the blood circulation time of the nanoparticles. After incubation with PBS, DMEM/F12, and DMEM/F12 with 10% FBS at 37 °C for 24 h, the diameter of the PH20/CCM@PMCS particles remained approximately 110 nm (Figure S6), indicating satisfactory dispersibility and stability. After incubation of PH20/CCM@PMCS for 36 h, the cell membranes were ruptured and nanoparticles were rapidly released (Figure S7).
Characterization of hybrid membrane-coated nanoparticles. (A) The preparation procedure of PH20/CCM@PMCS. (B) TEM images of PH20/SKOV3 membrane vesicle (PH20/SKOV3-M), PH20/ID8 membrane vesicle (PH20/ID8-M), h_CAFs membranes (h_CAF-M), m_CAFs membranes (m_CAF-M), h_PH20/CCM, and m_PH20/CCM (Scale bar: 100 nm). (C) SDS-PAGE protein analysis of cancer cell membrane, cancer-associated fibroblast membrane, and hybrid cell membrane proteins. (D) Western Blot analysis of characteristic proteins from cancer cell membrane, cancer-associated fibroblast membrane, and hybrid cell membrane proteins. (E) Images of mixed membranes and hybrid membranes (Scale bar: 20 μm). (F) (a) SEM images of stacked block shape MXene (Scale bar: 300 nm). (b) TEM images of stacked block shape MXene (Scale bar: 100 nm) (c) TEM images of dispersed MXene (Scale bar: 100 nm) (G) UV-visible absorption spectra of PMXene and PMCS. (H) AFM image of PMCS. (I) TEM images of PMXene, hybrid cell membranes and hybrid cell membranes coated PMXene (Scale bar: 100 nm). (J) The Zeta potential of PMXene, PMCS, h_PH20/CCM, h_PH20/CCM@PMCS, m_PH20/CCM, m_ PH20/CCM@PMCS. Data are expressed as mean ± standard deviation (S.D.)
Function of PH20/CCM@PMCS
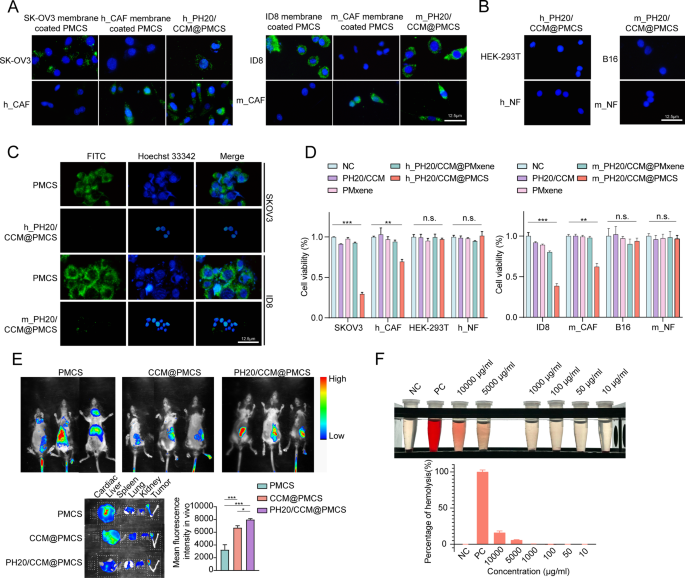
We validated the dual-targeting ability of PH20/CCM@PMCS toward cancer cells and CAFs. Fluorescein isothiocyanate (FITC, green) was used to label PMXene. PMCS encapsulated by the SKOV3 cell membrane can be internalized by SKOV3 cells but not by h_CAFs. In contrast, PMCS encapsulated by h_CAF cell membranes can be internalized by h_CAFs, but not by SKOV3. SKOV3 and h_CAFs can simultaneously encapsulate PMCS in the hybrid membrane. PMCS encapsulated by mouse-derived membranes also exhibited similar properties (Fig. 2A). Specifically, the hybrid membrane exhibited a dual-targeting ability. In addition, PMCS encapsulated by h_PH20/CCM and m_PH20/CCM were minimally internalized by other cancer cells or NFs (Fig. 2B), indicating the high targeting effect of PH20/CCM@PMCS. Escape from the endothelial reticular system is necessary for all nanomedicines injected into the bloodstream. PMCS and PH20/CCM@PMCS were subsequently co-cultured with RAW264.7 cells. The cell membrane shell effectively reduced the internalization of nanoparticles by macrophages (Fig. 2C). This may be attributed to the immune evasion function of cancer cell membranes [45]. To verify the biocompatibility of PH20/CCM@PMCS in vitro, we performed CCK8 experiments to observe the activity of six cell types, SKOV3, ID8, h_CAFs, m_CAFs, 293T, and HUVECs, after co-incubation with PH20/CCM, PMXene, PH20/CCM@PMXene, and PH20/CCM@PMCS. During co-incubation with cancer cells, CAFs, 293T cells, and HUVECs, PH20/CCM, PMXene, and PH20/CCM@PMXene did not inhibit cell viability, indicating that they are not significantly toxic. PH20/CCM@PMCS inhibited the viability of cancer cells and CAFs, but had no significant effect on 293T cells or HUVECs (Fig. 2D). The effects of different concentrations of PH20/CCM@PMCS on cancer cells and CAFs are demonstrated in Figure S8. The above results demonstrate that the cell membranes and nanocarrier PMXene themselves do not have inhibitory effects on cells. PH20/CCM@PMXene only exerts inhibitory effects on its target cells, indicating the good biosafety of PH20/CCM@PMXene.
The targeting and penetrating abilities of PH20/CCM@PMCS were evaluated in vivo. PMXene was labeled with CY7 and encapsulated in PH20/CCM before injection into orthotopic tumor-bearing C57BL/6 mice through the tail vein. Using an in vivo fluorescence imaging system (Fig. 2E), significant aggregation of CCM@PMCS and PH20/CCM@PMCS at the tumor site was observed in mice 24 h after intravenous injection, which was not observed in the PMCS group. PH20/CCM@PMCS was more concentrated within the tumor tissue than CCM@PMCS, indicating that PH20/CCM@PMCS could effectively penetrate the physical barrier in the tumor tissue, achieving deep treatment. Neither the heart nor the spleen showed significant fluorescence accumulation; however, in the CCM@PMCS and PH20/CCM@PMCS groups, the liver, lungs, and kidneys exhibited slight fluorescence after 24 h following intravenous injection, indicating the tumor-targeting ability of cell membrane-encapsulated nanoparticles.
A red blood cell hemolysis assay was used to evaluate the blood compatibility of PH20/CCM@PMCS at different concentrations (PMXene concentration: 10–10,000 µg mL-1). The percentage of hemolysis was calculated based on the absorbance of the supernatant of the PH20/CCM@PMCS and the red blood cell solution mixture (Fig. 2F). Under the working concentration (10 µg mL-1), negligible hemolysis (< 5%) was observed, confirming the good blood compatibility of the nanoparticles.
Dual-targeting, penetrating capability, and biocompatibility of PH20/CCM@PMCS. (A) Images of SKOV3 and h_CAF treated with SKOV3 membrane-coated PMCS, h_CAFs membrane-coated PMCS, and h_PH20/CCM-coated PMCS for 7 h. Images of ID8 and m_CAF treated with ID8 membrane-coated PMCS, m_CAFs membrane-coated PMCS, and m_ PH20/CCM-coated PMCS for 7 h. The nucleus is stained with DAPI (blue), and PMCS is labeled with FITC (green) (Scale bar: 12.5 μm). (B) Images of HEK-293T and h_NF treated with h_ PH20/CCM@PMCS for 7 h. Images of B16 and m_NF treated with m_PH20/CCM@PMCS for 7 h (Scale bar: 12.5 μm). (C) Images of RAW264.7 treated with PMCS, h_PH20/CCM@PMCS, and m_PH20/CCM@PMCS for 7 h (Scale bar: 12.5 μm). (D) CCK-8 assay indicated PH20/CCM, PMxene, and PH20/mPMxene had no significant inhibitory effect on either cancer cells or normal cells (N = 3). (E) The penetrating ability of PH20/CCM@PMCS was investigated by the orthotopic homograft in vivo (N = 3). The fluorescence images of harvested major organs and tumor at 24 h post-injection. (F) Percentage of red blood cell hemolysis at different concentrations of PH20/CCM@PMCS (N = 3). Data are expressed as mean ± S.D. and analyzed by ordinary one-way ANOVA. (* P < 0.05, ** P < 0.01, *** P < 0.001, n.s. no significance)
Effect of PH20/CCM@PMCS on ovarian tumors in Vitro
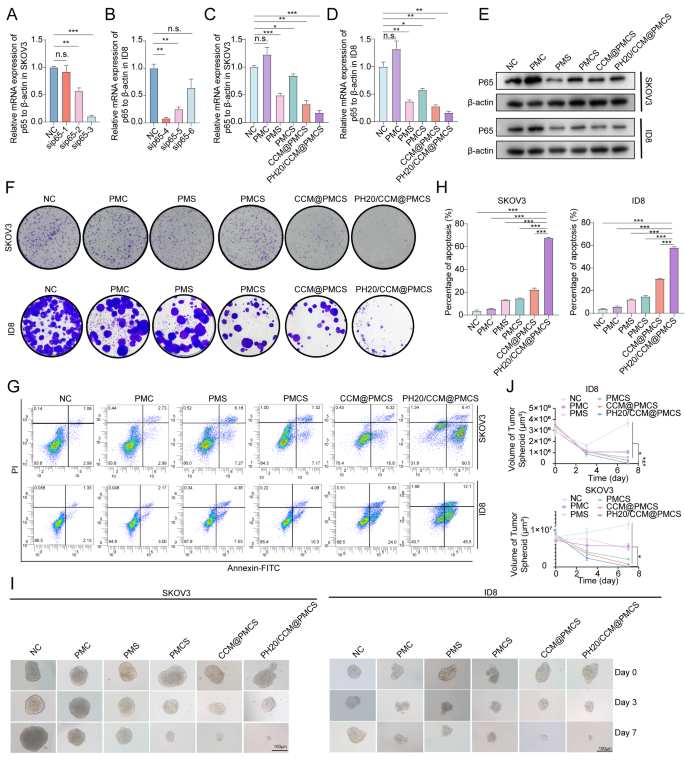
To select the most effective siRNA targeting p65 in human cells, we verified three siRNAs (sip65 #1, sip65 #2, and sip65 #3) targeting human p65 RNA in SKOV3 cells (Fig. 3A). Another three siRNAs targeting p65 in mouse cells (sip65 #4, sip65 #5, and sip65 #6) were assessed in ID8 for knockdown efficiency (Fig. 3B). The two siRNA strands with the highest knockdown efficiency (sip65 #3 and sip65 #4) were selected to construct the nanoparticles. Subsequently, we evaluated the mRNA and protein expression of p65 in the cells treated with PMC, PMS, PMCS, CCM@PMCS, and PH20/CCM@PMCS. The RNA and protein levels of p65 decreased significantly following PMS treatment, indicating that the nanoparticles successfully introduced siRNA into the cells and knocked down the target RNA. The RNA and protein levels of p65 increased following PMC treatment, but those in the PMCS, CCM@PMCS, and PH20/CCM@PMCS groups treated with sip65 were lower than those in the NC group (Fig. 3C, D, E). Next, we explored the antitumor efficacy of PH20/CCM@PMCSs in vitro. The cloning formation assay showed that PH20/CCM@PMCS significantly inhibited ovarian cancer cell growth (Fig. 3F). In addition, compared with that in the NC and PMCS groups, a significant increase in apoptosis was observed in the tumor cells treated with PH20/CCM@PMCS (Fig. 3G, H). We further investigated the antitumor efficacy of the engineered cell membrane-coated nanoparticles PH20/CCM@PMCS under complex 3D culture conditions by incubating PH20/CCM@PMCS with 3D cultured tumorspheres. A comparison of the changes in the volume of the tumorspheres after 7 days revealed that the volume of the tumorspheres decreased most after treatment with PH20/CCM@PMCS (Fig. 3I, J). This may be attributed to the stronger penetration of the encapsulation membrane after the engineered PH20 modification, indicating high efficacy of PH20/CCM@PMCS in antitumor therapy in vitro.
Anti-tumor effect of PH20/CCM@PMCS in vitro. (A) Knockdown efficiency of sip65 in SKOV3 (N = 3). (B) Knockdown efficiency of sip65 in ID8 (N = 3). (C) Relative RNA expression of p65 to β-actin in SKOV3 in each group (N = 3). (D) Relative RNA expression of p65 to β-actin in ID8 in each group (N = 3). (E) Relative protein expression of p65 in SKOV3 and ID8 in each group. (F) Colony formation assay images of tumor cells treated with PMC, PMS, PMCS, CCM@PMCS, PH20/CCM@PMCS. (G, H) Detection and quantitative analysis of apoptosis in SKOV3 and ID8 treated in each group by flow cytometry (N = 3). (I, J) 3D growth of tumors image and quantitative analysis of tumor sphere in NC, PMC, PMS, PMCS, CCM/PMCS, and PH20/CCM@PMCS group (Scale bar: 100 μm, N = 3). Data are expressed as mean ± S.D. and analyzed by ordinary one-way ANOVA. (* P < 0.05, ** P < 0.01, *** P < 0.001, n.s. no significance)
PH20/CCM@PMCS Induced Immunogenic Cell Death in Tumor cells
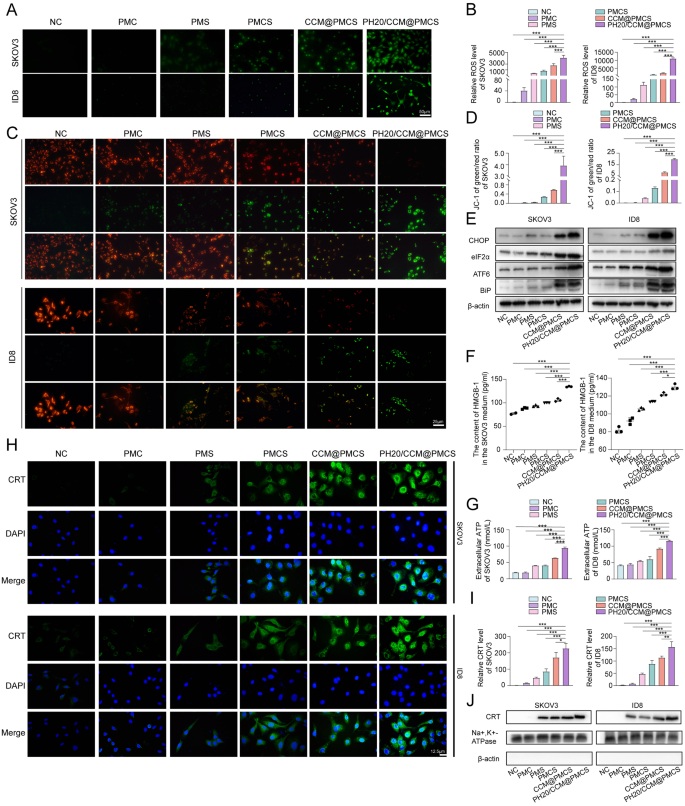
Considering that NF-κB is an important regulatory pathway for reactive oxygen species (ROS) production in tissue cells, the promotion of cell apoptosis by PH20/CCM@PMCS may depend on increased intracellular oxidative stress [46]. The generation of ROS was detected via DCFH-DA probes (green). The PMC group exhibited few ROS, whereas the PH20/CCM@PMCS group exhibited an intense increase in ROS levels (Fig. 4A, B). Moreover, the mitochondrial membrane potential was assessed using the JC-1 probe. After PH20/CCM@PMCS treatment, the mitochondrial membrane potential decreased (Fig. 4C, D), indicating an increase in cellular oxidative stress. High intracellular ROS can result in endoplasmic reticulum (ER) dysfunction [47, 48]. Therefore, we performed protein blotting analysis to investigate whether treatments of each group would affect ER stress. The identification of ER stress-related proteins indicated that PH20/CCM@PMCS remarkably induced ER dysfunction compared with other tested groups (Fig. 4E). ER stress and ROS are important intracellular pathways that induce immunogenic cell death (ICD) [49]. The translocation of calcium reticulum protein (CRT) to the cell membrane, extracellular release of adenosine 5ʹ-triphosphate (ATP), and secretion of high mobility group protein cassette 1 (HMGB1) are classic features of ICD [50,51,52]. Therefore, we explored the above three indicators in each group to detect whether cells underwent ICD. We collected the cell culture supernatant from the NC, PMC, PMS, PMCS, CCM@PMCS, and PH20/CCM@PMCS groups. The ELISA results show that the supernatant of the PH20/CCM@PMCS group exhibits a significant increase in the level of HMGB1 (Fig. 4F). Significant ATP secretion was observed in the PH20/CCM@PMCS group using the luciferase assay (Fig. 4G). To verify the membrane transfer of calcium reticulum proteins, cell membrane immunofluorescence staining and western blot analyses were performed. The PH20/CCM@PMCS group showed a significant increase in the membrane transfer of calcium reticulum protein (Fig. 4H, I,J). In short, these results demonstrate that PH20/CCM@PMCS effectively increased intracellular ROS and led to ER stress to induce the production of damage-associated molecular patterns, thus triggering ICD in tumor cells.
PH20/CCM@PMCS induced immunogenic cell death in tumor cells. (A, B) Fluorescence images with semiquantitative analyses of intracellular ROS production in SKOV3 and ID8 treated in each group (Scale bar: 50 μm). (C, D) Fluorescence images with semiquantitative analyses of SKOV3 and ID8 mitochondrial membrane potential (JC-1 probe) (Scale bar: 25 μm). (E) Levels of CHOP, elF2α, ATF6, and BIP in SKOV3 and ID8 in each group. (F) The concentration of HGBM1 released by SKOV3 and ID8 treated in each group (N = 3). (G) The concentration of ATP released by SKOV3 and ID8 treated in each group (N = 3). (H, I) Fluorescence images with semiquantitative analyses of CRT expression on the cell membrane of SKOV3 and ID8 (Scale bar: 12.5 μm). (J) Protein expression of CRT on the cell membrane of SKOV3 and ID8. Na+, K+-ATPase serves as an internal reference for cell membrane proteins. β-actin, a cytoplasmic protein was not observed to demonstrate cytoplasmic removal. Data are expressed as mean ± S.D. and analyzed by ordinary one-way ANOVA. (* P < 0.05, ** P < 0.01, *** P < 0.001)
PH20/CCM@PMCS regulate cytokine secretion in CAFs to reverse tumor-promoting TME
CAFs foster a supportive environment for tumor growth [53, 54]. Furthermore, CAFs promote tumor formation and progression by producing various cytokines, growth factors, and ECM proteins, which contribute to blood and lymphatic vessel formation, ECM remodeling, immune system suppression, drug resistance, and tumor invasion [55,56,57,58]. Hence, suppressing the release of cancer-promoting substances from CAFs might alter the TME, making it beneficial for inhibiting tumor growth. To further investigate the effect of PH20/CCM@PMCS on CAFs, the cytokine levels in the CAF supernatants treated with PH20/CCM@PMCS were measured using the Cytokine Proteome Profiler Array (Fig. 5A, B). Among them, 8 cytokines were downregulated, and 15 were upregulated. KOBAS3.0 was used for pathway enrichment analysis of the differential cytokines, and significant enrichment in angiogenesis, inflammatory immunity, and cell migration and adhesion was observed (Fig. 5C). The 23 differentially expressed cytokines were categorized into three groups based on their functions and the results of KEGG enrichment analysis (Fig. 5D), and their functions are listed in Table S1. The top six differentially expressed cytokines included GDF-15, GROα, Dkk-1, MMP-9, CD14, and osteopontin. Among them, osteopontin, Dkk-1, and MMP-9 participate in ECM remodeling and tumor cell invasive migration. Specifically, osteopontin induces HIF-1α to promote ovarian cancer progression and metastasis by activating the PI3-K/Akt survival pathway [59]. The DKK-1 protein inhibits tumor cell survival and migration by regulating β-catenin/E-cadherin signaling [60]. MMP-9 allows migration and invasion of ovarian cancer cells by degrading basement membrane components, ultimately leading to metastasis [61]. CD14, DPPIV, and GDF-15 are involved in inflammatory cell recruitment and immune cell infiltration and activation. Specifically, CD14high CD16low monocytes induce M2-like tumor-associated macrophages phenotype and suppress dendritic cell-activated CD4 + T-cell responses in ovarian cancer [62]. DPPIV is involved in the signal-transducing process. Cross-linking of DPPIV and CD3 with immobilized mAbs can induce T-cell activation and IL-2 production [63]. GDF15 promotes the production of inducible Treg cells of peripheral origin in hepatocellular carcinoma by interacting with CD48 [64]. Moreover, platinum-based chemotherapy has been reported to increase the levels of circulating GDF-15 in patients with cancer [65, 66]. Additionally, cytokines that play a key role in angiogenesis—angiogenin and VEGF—were notably reduced. In conclusion, changes in cytokines secreted by CAFs related to invasion, angiogenesis, and immune infiltration were observed following treatment with PH20/CCM@PMCS, and their real effects on TME required verification through further experiments.
PH20/CCM@PMCS alters cytokine levels secreted by CAFs. (A, B) Cytokine Proteome Profiler Array images and semiquantitative analysis of the supernatant of h-CAF treated with PH20/CCM@PMCS. (C) Pathway enrichment analysis of differentially secreted cytokines. (D) Schematic diagram of the effects of PH20/CCM@PMCS on CAF-mediated TME remodeling from three aspects: inhibition of angiogenesis, suppression of cancer cell invasion, and activation of immunity. Data are expressed as mean ± S.D
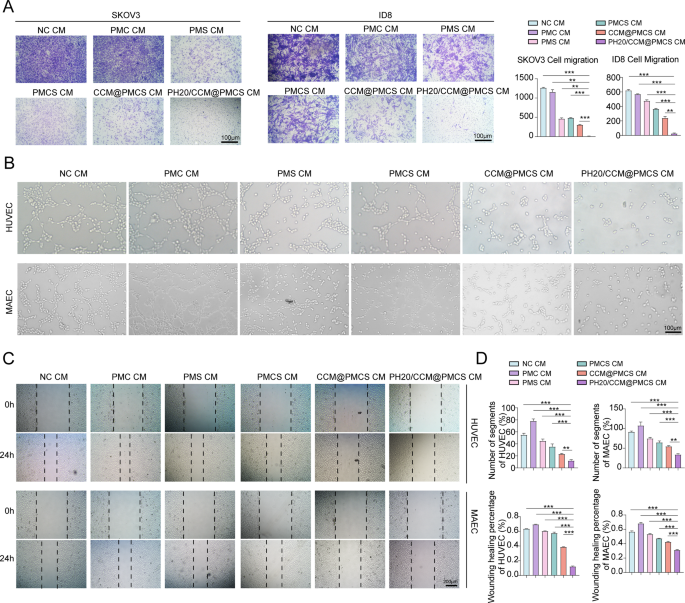
Next, we co-cultured cancer cells with conditioned medium (CM). The invasion capability of tumor cells was investigated using Transwell assay (Fig. 6A). Compared with tumor cells incubated with CM from other groups, a significant reduction in the migration rate was observed in the cells treated with PH20/CCM@PMCS CM. Thereafter, we explored the anti-angiogenic characteristics of CAFs treated in each group. The CM from the PH20/CCM@PMCS group hindered the migration and tube formation abilities of vascular endothelial cells in vitro compared with those from other groups (Fig. 6B, C,D).
PH20/CCM@PMCS remodels TME by influencing cytokine secretion of CAFs. (A) Images of transwell assay and the relative migratory number of ovarian cancer cells treated with NC CM, PMC CM, PMS CM, PMCS CM, CCM@PMCS CM, and PH20/CCM@PMCS (Scale bar: 100 μm, N = 3). (B) Tube formation assays of HUVEC treated with different CMs (Scale bar: 100 μm). (C) Wound healing assays of HUVEC treated with different CMs (Scale bar: 200 μm). (D) The statistical results of tube formation assays and wound healing assays (N = 3). Data are expressed as mean ± S.D. and analyzed by ordinary one-way ANOVA. (* P < 0.05, ** P < 0.05, *** P < 0.001)
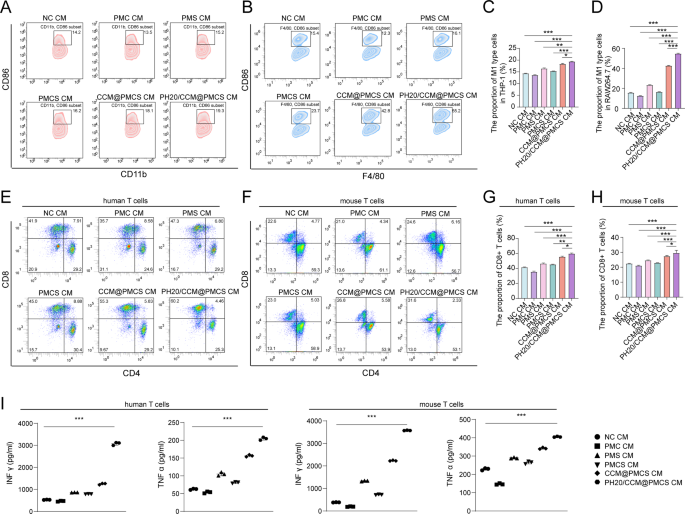
Subsequently, we investigated the effects of CAFs on immune function after PH20/CCM@PMCS treatment. Compared with NC, the CM from h_PH20/CCM@PMCS increased the average percentage of CD86 + CD11b + macrophages from 14.2 to 19.3%; whereas, the CM from m_PH20/CCM@PMCS increased the average percentage of CD86 + F4/80 + macrophages from 15.4 to 55.2% (Fig. 7A, B,C, D). This may be attributed to the inhibition of the NF-κB pathway, which is involved in the tumor inflammatory response. The cytokines secreted by CAFs treated with PH20/CCM@PMCS significantly stimulated macrophage polarization toward the M1 type compared to the PMCS treatment. This effect may likely occur due to the increased internalization of nanoparticles by CAFs and the enhanced internalization of hybrid-cell membranes by macrophages as tumor antigens, further promoting their polarization toward the M1 type. These results indicated that PH20/CCM@PMCS may contribute to macrophage polarization and reshape the TME. CD8 + cytotoxic T cells (CTL) are one of the key immune surveillance cells in the TME, which are a positive indicator of prognosis. Increasing the proportion of CTL in the tumor tissues of the patients can help inhibit tumor progression. To test the effect of CAFs on CTL activation following PH20/CCM@PMCS treatment, we cultured T cells using CMs from different treatment groups. The number of activated T cells that differentiated into CD8 + T cells in the PH20/CCM@PMCS group was almost 50% higher than that in the NC group (Fig. 7E, F,G, H). Further, we assessed IFN-γ and TNF-α secreted from T cells in each treatment group through ELISA. The highest IFN-γ and TNF-α levels were observed in the PH20/CCM@PMCS group, indicating functional activation of CTL (Fig. 7I). Collectively, PH20/CCM@PMCS regulates cytokine secretion in CAFs to reverse the tumor-promoting TME.
PH20/CCM@PMCS remodels the immune environment by influencing cytokine secretion of CAFs. (A) Proportion of M1 macrophages (CD86 + CD11b+) in THP-1 after treatment with different CMs (N = 3). (B) Proportion of M1 macrophages (CD86 + F4/80+) in RAW264.7 after treatment with different CMs. (C) The statistical results of M1 type THP-1 proportion. (D) The statistical results of M1 type RAW264.7 proportion. (E) Proportion of human CD8 + T cells after treatment with different CMs (N = 3). (F) Proportion of mouse CD8 + T cells after treatment with different CMs (N = 3). (G) The statistical results of human CD8 + T cell proportion. (H) The statistical results of mouse CD8 + T cell proportion. (I) IFN γ and TNF α were quantified by ELISA, in the culture supernatants of T cells stimulated with different groups (N = 3). Data are expressed as mean ± S.D. and analyzed by ordinary one-way ANOVA. (* P < 0.05, ** P < 0.05, *** P < 0.001)
Inhibitory effect of PH20/CCM@PMCS in orthotopic homograft
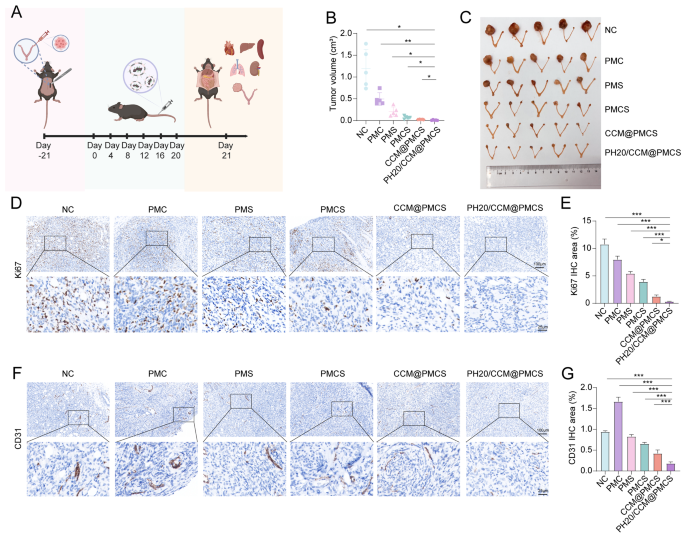
To confirm the role of PH20/CCM@PMCS in EOC growth in vivo, we selected healthy C57BL/6 mice to construct orthotopic homografts and designed in vivo experiments (Fig. 8A). Tumor-bearing mice were randomly divided into six groups and injected with physiological saline, PMC, PMS, PMCS, CCM@PMCS, or PH20/CCM@PMCS through the tail vein on Day 0, 4, 8, 12, 16, and 20. During the treatment period, no significant differences in body weight were observed among different groups of mice (Figure S9). After treatment, we collected the tumors from each group and measured their volumes. Treatment of PMC and PMS showed a slight inhibitory effect on tumors compared with the NC group. In contrast, tumor growth was significantly inhibited in the PH20/CCM@PMCS group. Compared with the tumor volume of the PMCS group without hybrid membrane coverage, the tumor volume of the CCM@PMCS and PH20/CCM@PMCS groups with hybrid membrane coverage was reduced by 63.37% and 85.30%, respectively. This suggests a stronger anti-tumor effect of hybrid membrane-coated nanoparticles, which may be related to the greater amounts of hybrid membrane-coated nanoparticles being ingested. Furthermore, the strong penetration of PH20/CCM@PMCS increases the delivery of nanoparticles, making the efficacy even more significant. In conclusion, PH20/CCM@PMCS significantly reversed the growth of the homograft tumors (Fig. 8B, C). Compared with other groups, the number of Ki67-positive cells stained via immunohistochemistry (IHC) was significantly reduced after treatment with PH20/CCM@PMCS or CCM@PMCS (Fig. 8D, E), indicating a stronger inhibition of tumor proliferation. The tumor tissue was stained using Masson’s staining to observe its histopathology. Notably, in the PH20/CCM@PMCS treatment group, the tumor tissue was sparse, and the cell nucleus size decreased, whereas in the control group, the tumor tissue was dense, and the cell nucleus size showed strong heterogeneity (Figure S10).
Furthermore, we investigated the antitumor mechanisms of these nanoparticles. We evaluated the formation of blood vessels in tumor tissues by measuring CD31 expression. Interestingly, PMC promoted tumor angiogenesis, which was similar to a previous clinical study and may be associated with chemotherapeutic drug-induced hypoxia [67]. Compared with NC, the CD31 levels in the PMS and PMCS groups did not change significantly, whereas the CD31 levels in the PH20/CCM@PMCS group went down nearly 75%, suggesting that PH20/CCM@PMCS had an inhibitory effect on tumor angiogenesis (Fig. 8F, G).
Anti-tumor effect of PH20/CCM@PMCS in orthotopic homograft. (A) Experimental procedure in vivo. (B) Tumor volume after 21-day treatment (N = 5). (C) Excised ovaries and uterus from NC, PMC, PMS, PMCS, CCM@PMCS, PH20/CCM@PMCS after 21-day treatment. (D, E) Immunohistochemical staining of Ki67 with semiquantitative analyses of excised tumor slices in each group (Scale bar: 10X: 100 μm, 40X: 25 μm, N = 3). (F, G) Immunohistochemical staining of CD31 with semiquantitative analyses of excised tumor slices in each group (Scale bar: 10X: 100 μm, 40X: 25 μm, N = 3). Data are expressed as mean ± S.D. and analyzed by ordinary one-way ANOVA. (* P < 0.05, ** P < 0.05, *** P < 0.001)
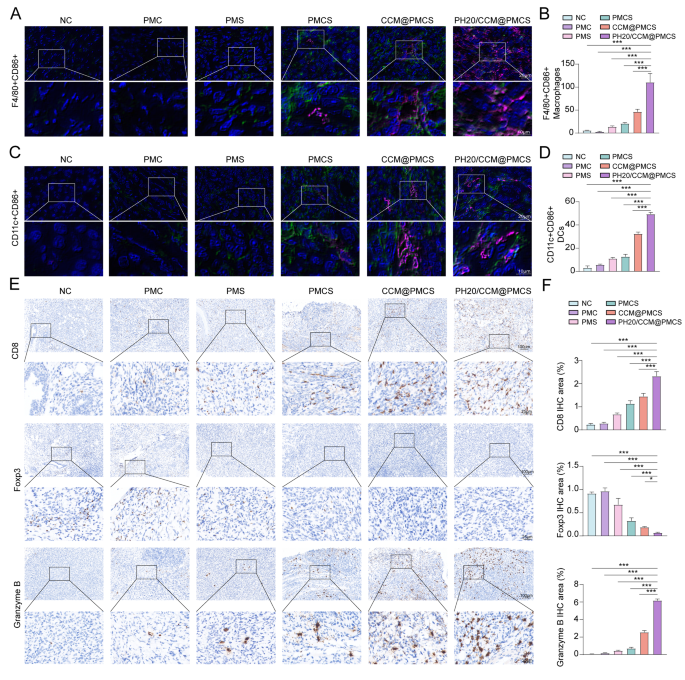
To verify the effect of PH20/CCM@PMCS on immune activation in vivo, we measured the number of macrophages in the tumor tissues of each mouse group. Compared with other treatments, PH20/CCM@PMCS significantly increased the aggregation of F4/80 (green) positive macrophages in the tumor tissue, and the macrophages expressed CD86 (red), indicating polarization toward the M1 type (Fig. 9A, B). To further assess TME transformation, we measured the levels of dendritic cell maturation at the tumor site. The levels of CD11c+(green) CD86+(red) dendritic cells were elevated in the PH20/CCM@PMCS group compared with the other groups (Fig. 9C, D), indicating that PH20/CCM@PMCS may contribute to dendritic cell maturation. Subsequently, we evaluated the T cells expressing CD8 and granzyme B in the tumor tissues using IHC and observed increased cytotoxic T-cell aggregation in the PH20/CCM@PMCS-treated group. The staining of T cells with immunosuppressive function (FOXP3-positive) revealed decreased Treg aggregation in the PH20/CCM@PMCS-treated group (Fig. 9E, F). These results indicate that PH20/CCM@PMCS relieved the TME by promoting immune infiltration of the tumor tissue.
Effects of PH20/CCM@PMCS on remodeling immune infiltration in TME. (A, B) Immunofluorescence staining for F4/80 (green) and CD86 (red) with semiquantitative analyses of excised tumor slices in each group (Scale bar: 64X: 20 μm, X: 180X: 10 μm). (C, D) Immunofluorescence staining for CD11c (green) and CD86 (red) with semiquantitative analyses of excised tumor slices in each group (Scale bar: 64X: 20 μm, 180X: 10 μm). (E, F) Immunohistochemical staining of CD8, Foxp3, and Granzyme B with semiquantitative analyses of excised tumor slices in each group (Scale bar: 10X: 100 μm, 40X: 25 μm, N = 3). Data are expressed as mean ± S.D. and analyzed by ordinary one-way ANOVA. (* P < 0.05, ** P < 0.05, *** P < 0.001)
Apart from these, varying degrees of cancer lung metastasis were observed in mouse lungs. Hematoxylin and eosin (H&E)-stained pathological sections of metastatic lesions were observed (Figure S11), and compared with the NC group, both the PH20/CCM@PMCS and CCM@PMCS groups exhibited a significant reduction in metastatic lesions, indicating the inhibitory effect of PH20/CCM@PMCS on distant ovarian cancer metastasis.
After 21 days of treatment, H&E staining of important organs of the mice, including the heart, liver, spleen, lungs, and kidneys, revealed no significant damage to these organs (Figure S12A). The venous blood of the mice was collected for biochemical analysis. Indicators such as the UA, CR, ALT, AST, albumin, and total protein levels were all within the normal ranges (Figure S12B). The above results demonstrated excellent targeting and penetration abilities and good biosafety of PH20/CCM@PMCS in mice in vivo.
Assessment of metal nanodrug metabolism is essential for further in vivo application. To investigate the systemic circulation time of the nanoparticles, 10 µL of blood was collected for measurement at different time points after injection into healthy C57BL/6 mice. The plasma concentration of the nanoparticles was negligible at 48 h after injection (Figure S13). Next, we investigated the excretion and tissue deposition of PH20/CCM@PMCS in tumor-bearing mice. PH20/CCM@PMCS was injected intravenously into C57BL/6 mice loaded with orthotopic homografts. Ti levels were measured in urine and feces at 12, 24, and 48 h to monitor excretion. Ti excretion in the urine and feces of mice after 48 h reached 20.09% and 16.80%, respectively (Figure S14). The heart, liver, spleen, lungs, and kidneys of mice were collected 21 days after treatment to detect the biodistribution of nanoparticles. Intravenous PH20/CCM@PMCS was mainly deposited in the liver and spleen due to nanoparticle capture by the endothelial reticular system. Nanoparticles were deposited in the kidneys, likely due to the excretion of nanoparticles through the kidneys (Figure S15). Overall, nanoparticle deposition in main organs was low, similar to the results from in vivo fluorescence imaging in small animals. High excretion and low off-target effects of nanoparticles ensure the safety of their clinical translation for cancer therapy.
PH20/CCM@PMCS potentiates Anti-PD-L1 blockade therapy
PD-L1 monoclonal antibody is a widely used immune checkpoint inhibitor for cancer treatment, but its response rate is low in ovarian cancer [68]. As PH20/CCM@PMCS induced ICD and enhanced immune infiltration in the TME, we evaluated its potential to improve the efficacy of tumor immune checkpoint therapy. We administered PH20/CCM@PMCS separately, anti-PD-L1, or a combination of both in ID8 tumor-bearing mice (Figure S16A), whereas CBP was used as a standard treatment for control. Efficacy assessment of ovarian in situ tumor growth showed that anti-PD-L1 alone did not significantly affect tumor growth, suggesting that this tumor subtype exhibited a limited response to immune checkpoint inhibition. In contrast, PH20/CCM@PMCS alone significantly inhibited tumor growth and was more effective than CBP alone. Moreover, tumor inhibition by PH20/CCM@PMCS was substantially augmented in combination with anti-PD-L1 (Figure S16B, C). The therapeutic interventions did not adversely affect physiological parameters such as body weight (Figure S16D) and liver and kidney function (Figure S16E). Tumor growth inhibition achieved using PH20/CCM@PMCS was further enhanced in combination with anti-PD-L1.


