Data acquisition
After a comprehensive review of 2,919 publication literature, 45 papers were selected and considered relevant to this research. 293 different nanostructured surfaces were studied in terms of substrate material, nanostructure shape and size, and surface hydrophobicity. The raw dataset is provided in Table S5. Data distribution of experiment parameters in the database was visualized by histograms and kernel density estimation (KDE) plots (Fig. S1). As depicted in the figure, some outliers existed in the database. For example, most nanopatterns are found in the height range 0–6500 nm, but a few reached 32,000 nm.
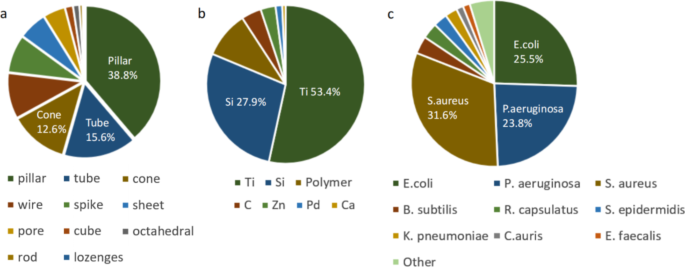
Titanium and silicon were the main choices of substrate materials for the fabrication of nanostructures. In contrast, the dataset is more evenly distributed among the bacterial species, centred on E. coli, P. aeruginosa, and S. aureus (Fig. 1). Of these, 121 were studies of Gram-positive bacteria and 173 were studies of Gram-negative bacteria. The nanopattern is also more evenly distributed in terms of shape, consisting mainly of pillar, but also partly of tube, cone, wire, spike, etc. There are 192 surfaces that are hydrophilic with a WCA ≤ 90° and 102 hydrophobic surfaces with a WCA > 90°. Details of the dataset can be found in the supplementary information.
Data pre-processing
The primary dataset comprised 293 rows and 12 columns (11 inputs, 1 output). The input data consisted of diameter (nm), height (nm), spacing (nm), aspect ratio, surface roughness (nm), water contact angle (WCA) (°) reported in numeric values. Variables with nominal values included materials, shape of nanopatterns, bacteria Strain, Gram-stain type motility, and shape of bacteria as summarized in Tables 1, 2 and 3.
Input transformation
For materials of nanostructured surfaces, a simplified classification has been made due to the wide variety contained, e.g. Ti, Ti6Al4V, TiOH and TiO2 are classified as Ti-based.
For nanotopogrpahy, the features such as diameter, height, spacing and aspect ratio are a good representation of the shape of the nanopattern, thus these features have been retained and the shape of the nanopattern has been eliminated. Surface roughness has approximately 90% or more missing values and was therefore excluded. Diameter, height, spacing, aspect ratio, and WCA all had less than 30% missing values and were retained for the next data imputation process.
Similarly, the Gram-stain type, motility and shape are representative of the bacterial membrane structure, therefore these three features are selected as input and the name of bacterial species is eliminated.
Output transformation
We chose 70% as a threshold for our classification model building. This threshold is not arbitrarily set but is a reflection of a consensus within the nanobactericidal surface research community. We specifically referenced several articles that included nanobactericidal surfaces with more than five different parameters rather than a single morphology [30,31,32,33,34,35,36,37,38]. The distribution of bactericidal efficiency in these experiments was relatively uniform from 0 to 100%, with efficacious surfaces concentrated in the range of 60–80%, with 70% emerging as a practical benchmark that balances stringent bactericidal performance with achievable targets in diverse conditions. Thus, for regression models we kept the percentage of bactericidal efficiency as output features; for binary classification models we simplified the numeric bactericidal efficiency to 2 classes, i.e. whether it is a successful bactericidal surface.
Classification model building
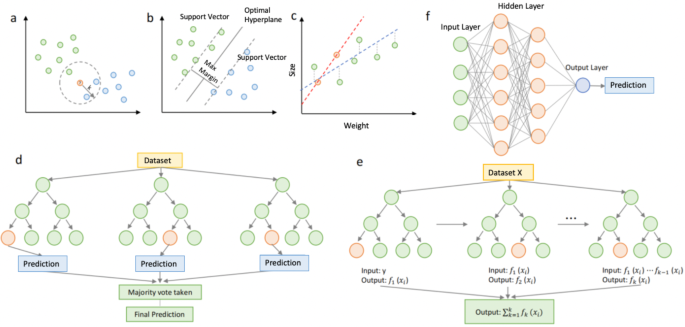
Model selection was critical for the accuracy of ML prediction, and we have chosen seven state-of-the-art algorithmic models for predicting the bactericidal efficiency, which included K-nearest neighbor (KNN), support vector machine (SVM), extreme gradient boost (XGBoost), gradient boosting machine (GBM), random forest (RF), multilayer perceptron (MLP) for classification modelling and ridge regression (RR), XGBoost, GBM, KNN for regression modelling [30,31,32,33]. A brief summary is illustrated in Fig. 2 and explained in Table 4.
Preliminary modelling
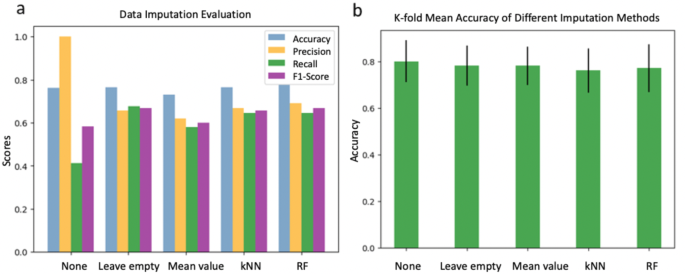
After the initial screening, the missing values were imputed, using 5 different imputation strategies: None, Leave empty, Mean, KNN and RF (Explained in detail in the method section). Performances of different data imputation methods were compared, as shown in Fig. 3. It can be seen from the plots that different data imputation methods did affect model performance. Of the three active filling blank methods, RF performed the best, with the highest accuracy and F1 scores. The ‘None’ group had a high precision, which means the high credibility of a claim that a case is positive. However, it has a relatively low recall, which indicates some false positives. While the ‘leave empty’ group was more evenly split across all indicators. Further comparison of the results of their 10-fold cross-validation revealed that the mean accuracy of the different imputations showed little difference, stabilising at around 78%. Therefore, the ‘None’ group, the ‘leave empty’ group and the RF group were retained for the model building to further compare the impact of the data imputation methods on the performance of the models.
After data transformation the following three datasets were obtained for the model building step: Dataset I (n = 294, Leave empty group); Dataset II (n = 294, RF group); Dataset III (n = 140, None group). To further build a regression model to predict the bactericidal efficiency of successfully bactericidal surfaces, we extracted data for the RF group with a bactericidal efficiency greater than 70% as Dataset IV (n = 105).
Classification model building
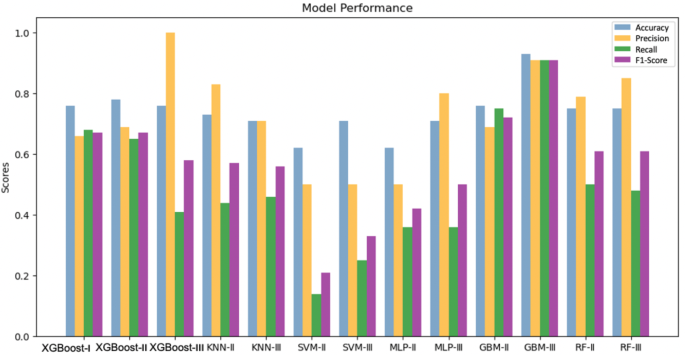
Following preliminary modelling, we trained various classification models, and all model parameters were tuned to the best combination. By traversing all the model parameters, the best combination of parameters is selected (see Table S1). Model performance results are summarized in Fig. 4 and Table S3. The results suggest that the XGBoost and GBM models exhibit overall higher accuracy and less fluctuation, which indicated a more stable performance compared to the other algorithms employed (KNN, SVM, and MLP). It is quite interesting to note that most of the models built are high-accuracy but low-recall systems, returning very few results, but most of its predicted labels are correct when compared to the training labels. In comparison, XGBoost-I, II and GBM-III show high accuracy rates of 0.76, 0.78 and 0.93 respectively, and relatively high precision and recall.
We then compared the 10-fold validation results of the XGBoost and GBM models (Fig. S2). The GBM-III and XGBoost-III models have the highest average accuracy of 0.81 and 0.80 respectively, while XGBoost-III has smaller variation, representing greater precision. Therefore, the GBM-III model had the best overall performance, with an average accuracy of 0.81.
To further test the performance of the model with different data imputation methods, we compared the confusion matrixes to assess the performance of XGBoost models (XGBoost-I, II, III). The confusion matrices for XGBoost-I and II are identical (Fig. S3), indicating that using RF as a data imputation in this study is a non-inferior approach.
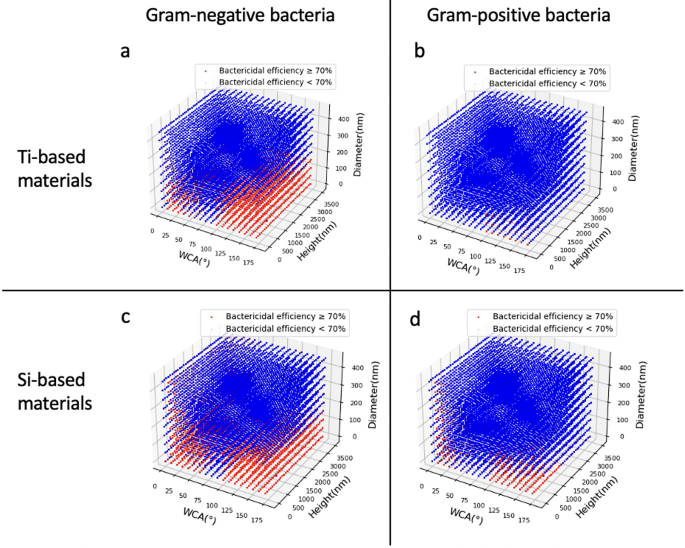
Subsequently, we utilised four new enumeration datasets (Ti-based nanostructured surfaces against Gram-negative bacteria, Ti-based nanostructured surfaces against Gram-positive bacteria, Si-based nanostructured surfaces against Gram-positive bacteria and Si-based nanostructured surfaces against Gram-negative bacteria with 829,448 datapoints in each dataset) to gain further insights into the nanostructured parameters and bactericidal efficiency of the nanostructure parameters and bactericidal efficiency. Based on the GBM-III models, we used the enumerated dataset to create a bactericidal efficiency map (Fig. 5). According to the figure, most of the high bactericidal efficiency surfaces, both Ti-based and Si-based materials, have polar WCAs, i.e., superhydrophilic and superhydrophobic. The nanostructured surfaces are overall more efficient in bactericidal activities for Gram-negative bacteria than for Gram-positive bacteria. In addition, the diameter of highly bactericidal surfaces is typically less than 200 nm.
Bactericidal efficiency prediction map: (a) Ti-based nanostructured surfaces against Gram-negative bacteria, (b) Ti-based nanostructured surfaces against Gram-positive bacteria, (c) Si-based nanostructured surfaces against Gram-positive bacteria, and (d) Si-based nanostructured surfaces against Gram-negative bacteria
Feature importance analysis and model interpretation
Overview of feature importance
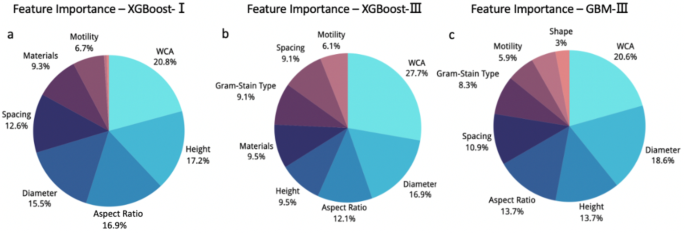
Interpreting the model provides valuable insights into its learning characteristics. Feature importance learnt by the GBM-III model was plotted to represent the ML’s interpretation of the correlation between different features and bactericidal efficiency. The feature importance of the XGBoost-I, III; models were also analysed and used to compare the differences between the conclusions drawn under the different algorithms. The feature importance analysis for both models yielded similar conclusions (Fig. 6), showing that the top four importance rankings for both models were WCA, height, diameter and aspect ratio, all of which are features of nanotopography. This suggests that nanotopography is indeed the main factor dominating the bactericidal activity of nanostructured surfaces, which is also consistent with the mechano-bactericidal concept mentioned previously. For WCA, the feature importance is 20.8%, 27.7%, and 20.6% in the XGBoost-I, III; and GBM-III models, respectively. Although the majority of surfaces in the dataset were hydrophilic, the least-tested hydrophobic surfaces have shown higher success rates than their hydrophilic counterparts. The possible reason is that hydrophobic and hydrophilic surfaces have different mechanisms of bacterial inhibition, as mentioned previously, one preventing bacteria from adhering and the other killing them when they do, but the different inhibition mechanisms achieve the same purpose.
Model interpretation for topographical features
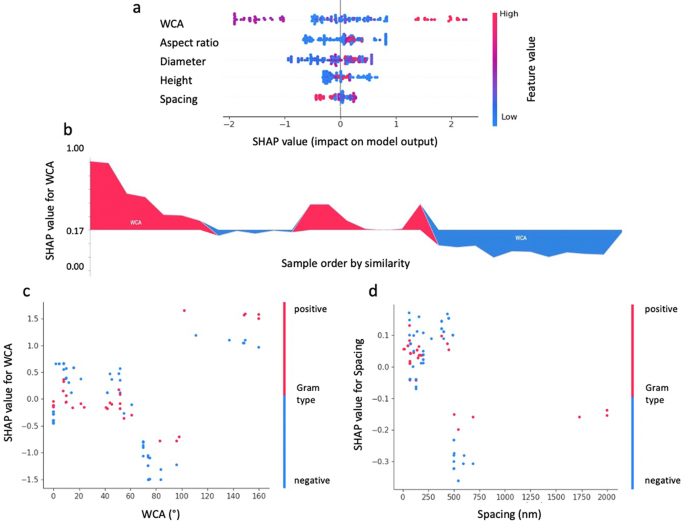
Figure 7 shows the Shapley additive explanations (SHAP) of topographical features. SHAP values is a unified framework to interpret ML predictions proposed by Lundberg and Lee [30], to describe how much each feature contributes to the predictions. In this ML model, the SHAP and feature values of the WCA are evenly distributed on the x-axis (Fig. 7a), while it can be concluded from the distribution of high feature value points that high WCA has a certain positive effect on bactericidal efficiency. Figure 7b elaborates on the variability in the impact of WCA on the model’s output across different samples. The analysis highlights that WCA values contributing positively to the model’s output predominantly fall within the ranges of 0–10 degrees or 160–180 degrees, as indicated by the red zones in the plot. These ranges correspond to surfaces that are extremely hydrophilic or hydrophobic, respectively, both of which are considered beneficial for bactericidal activity. Conversely, WCA values situated around the median, predominantly encapsulated within the blue zones of the plot, are associated with a negative impact on the output value. This suggests that surfaces with median WCA values may represent a less effective or undesirable range for bactericidal applications, indicating a complex relationship between surface wettability and bactericidal efficiency that is dependent on the extremity of the hydrophilic or hydrophobic nature of the surface.
SHAP values analysis summary for XGBoost-III model. (a) SHAP values of different features show their contributions to the model output on the local scale. Impact: The horizontal location shows whether the effect of that value is associated with a higher or lower prediction; Original value: Colour shows whether that variable is high (in red) or low (in blue) for that observation; (b) SHAP summary force plot for WCA effects; SHAP dependence plots articulate the intricate relationship between the (c) WCA and Gram types, and (d) Spacing and Gram types
Height and diameter are directly related to the bacteria-nanopattern contact area, while the tip size of the nanopattern is very important as it is the first point of contact between the bacteria and the surface [43]. The ML model shows that both diameter and height are positively correlated with bactericidal efficiency. Some studies based on analytical models support our conclusions, which suggest that a larger radius provides a wider contact area, driving the suspended region of the membrane to attempt to accommodate the change in the perimeter by stretching and eventually rupturing [23, 44]. However, smaller tip radius could induces higher pressure on the bacterial membrane, enhancing the bactericidal effect of the nanostructured surface [5].
The SHAP values for aspect ratio indicate that high aspect ratios have a positive effect on bactericidal efficiency. This is in line with Linklater et al. study [22], which demonstrated that the flexibility of a high aspect ratio structure enhances the elastic energy storage of the nanostructure and releases this energy through bending when in contact with bacteria, thereby increasing the bactericidal activity of the nanostructured surface.
Model interpretation for material properties and bacterial species
It is noteworthy that the material properties of the nanostructured surface account for a small proportion of the feature importance. This corresponds to the mechanisms revealed from some experimental approaches, i.e. the mechano-bactericidal mechanism on nanostructured surfaces is independent of chemical effects, as the functionality (bactericidal ability) was shown to persist across materials [7]. However, recent studies have suggested that biological and chemical processes also play a synergistic role in the bactericidal activity of nanostructured surfaces [45,46,47]. For example, Jenkins et al. proposed a synergistic ROS-mediated mechanism of mechano-bactericidal activity, which involves chemistry at the bacterial level, in contrast to the purely mechano-bactericidal model currently proposed [46].
Furthermore, the species of bacteria as a biological factor is not of high importance in the ML model, a possible reason is the limited dataset, which focuses on only a few specific bacteria. Whereas it is now generally accepted that Gram-negative bacteria are more vulnerable to the bactericidal effects of nanostructures than Gram-positive bacteria because of the differences between their bacterial membrane structures. In the SHAP dependence analysis (Fig. 7c and d), we posit that Gram-positive bacteria demonstrate increased sensitivity to hydrophilic surfaces with nanostructured spacing below 250 nm. While the SHAP dependence plot distribution for Gram-negative bacteria in relation to WCA and spacing appears relatively dispersed.
Individual data points analysis and comparative analysis
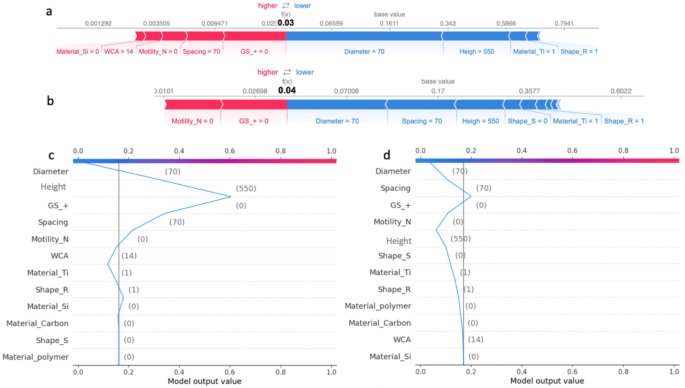
To enhance the comprehension of why certain features exhibit a more pronounced impact than others within our dataset, we employed an analysis of individual SHAP value plots corresponding to specific data points. We selected three representative data points for this analysis, two of which are presented below, with the remaining details provided in Fig. S5 (Tables 5 and 6).
Case 1: Silicon-based nano pillar against P. Aeruginosa
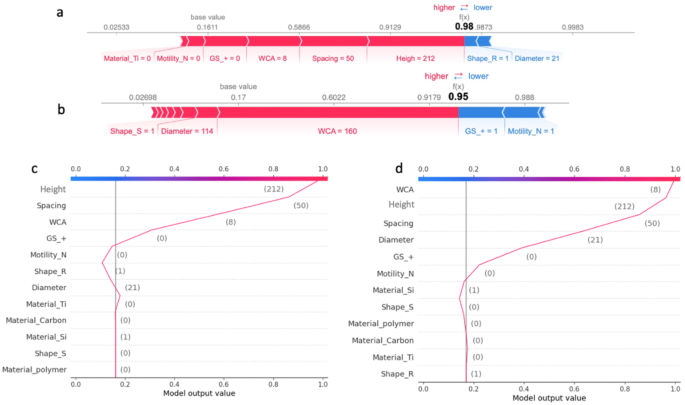
Comparative Analysis of Individual SHAP Values for the XGBoost-III Model and MLP-III Model – Case 1: (a) Individual SHAP force plot for XGBoost-III Model; (b) Individual SHAP force plot for MLP-III Model; (c) Individual SHAP decision plot for XGBoost-III Model; (d) Individual SHAP decision plot for MLP-III Model
Figure 8 illustrates that ‘Height’ has a significant positive SHAP value, indicating that as the height of the nanostructures increases, it contributes more to the model’s prediction of bactericidal efficiency against P.aeruginosa cells. This aligns with the conclusion in this study [12], which suggests that higher nanostructures on surfaces lead to a decrease in bacterial adhesion due to reduced contact area between the bacteria and the substratum.
In contrast, ‘Material’ has a minor impact on the output value, which is consistent with the previous reports stating that the nanoscale topography influences bacterial attachment behaviour, orientation, and the expression of attachment organelles (fimbriae), with a preference for certain substratum types [49].
The importance of height in these figures supports the notion that the physical dimensions of surface nanoarchitecture and material stiffness are critical factors in the adhesion and potential killing of bacterial cells.
Case 2: Titanium-based nano tube against P. Aeruginosa
Comparative Analysis of Individual SHAP Values for the XGBoost-III Model and MLP-III Model – Case 2: (a) Individual SHAP force plot for XGBoost-III Model; (b) Individual SHAP force plot for MLP-III Model; (c) Individual SHAP decision plot for XGBoost-III Model; (d) Individual SHAP decision plot for MLP-III Model
In this case, the dimensions, specifically the diameter and height, of the nanostructures used in the dataset are significantly smaller relative to the overall range observed. In Fig. 9, although the ‘GS’ feature exerts a significant positive effect on the output value, the adverse impacts attributable to both ‘Diameter’ and ‘Height’ on the bactericidal effectiveness of the nanostructures culminate in a final model output of zero. The study that includes this case involved assessing the bactericidal efficiency of nanostructures with identical structural parameters against various bacterial strains. Notably, the nanostructures demonstrated enhanced effectiveness in eliminating Gram-positive bacteria.
Furthermore, the positive impact associated with ‘GS’ indicates that the model identifies the presence of Gram-negative bacteria as a factor reducing the likelihood of poor bactericidal performance, which is in alignment with the conclusion of the study [48]. While the SHAP value analysis for ‘WCA’, suggests a negligible role of this feature in bactericidal efficiency. The implication is that surfaces do not exhibit extreme hydrophilicity, therefore having a relatively minor impact. The insights from the model support the observation that sharp, elongated nanostructures can disrupt bacterial cells non-selectively, whereas shorter, blunt structures might necessitate more precise interactions to overcome the defences of different bacterial species, reflecting their adaptation to the ecological niches they inhabit [30].
In addition, we performed a comparison of the SHAP values for both the XGBoost and MLP algorithms by examining them in each case, as illustrated in the accompanying Figs. 8 and 9 and Fig. S4. The consistency of the results across these scenarios underscores the robustness and interpretative capability of our model.
Regression model building
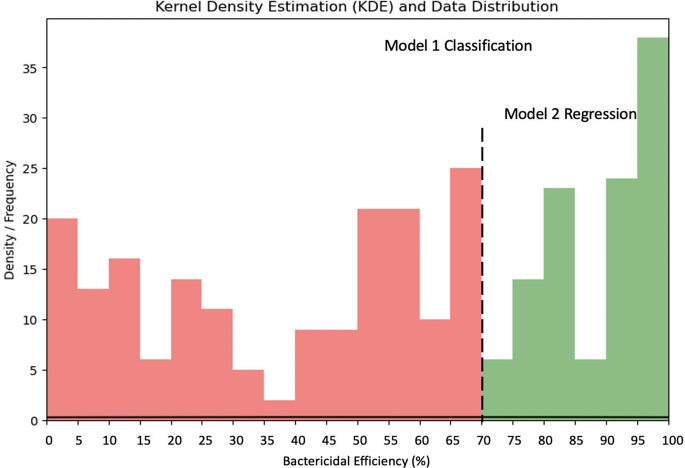
Based on the results of the classification model, a regression model was further developed for nanostructured surfaces with bactericidal efficiency greater than 70%. Figure 8 shows the distribution of bactericidal efficiency in the dataset and the range of data targeted by the classification/regression model.
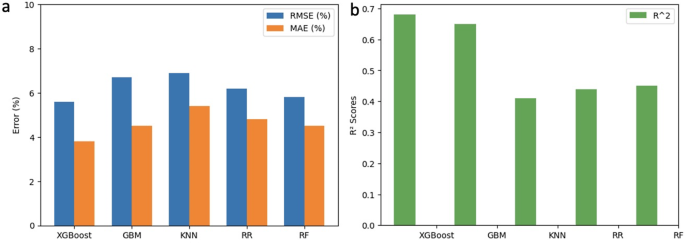
By traversing all the model parameters, the best combination of parameters is selected (see Table S2). The performance results are summarised in Fig. 9 and Table S4. As mentioned above, lower RMSE and MAE values indicate better predictive performance, while higher \(\:{R}^{2}\) values indicate a better fit of the model to the data and a better overall adaptation to the data. Of the four models, the XGBoost regression model had an outstanding performance with the lowest RMSE and MAE and the highest \(\:{R}^{2}\) (50%). The relatively low \(\:{R}^{2}\) values observed in the table may be attributed to the limited amount of data available for analysis (Figs. 10, 11, and 12).
Sequence of Classification and Regression model that predicts bactericidal efficiency of nanostructured surface. The classification model determines whether the nanostructured surface is capable of effective bactericide, i.e., whether the bactericidal efficiency is greater than or equal to 70%. The regression model predicts values of bactericidal efficiency for nanostructured surfaces with > 70% bactericidal efficiency
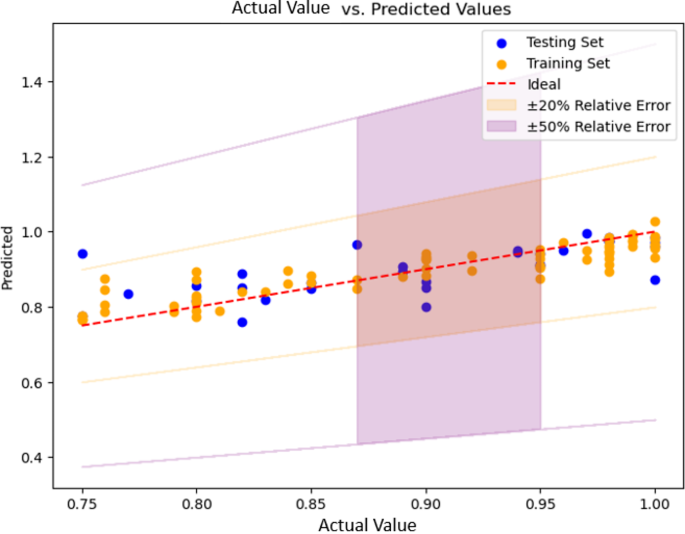
The regression model showed consistent performance on both the training and test sets, with all predictions within a relative error of ± 20%, except for one data from the test set (Fig. 10). This demonstrates the model’s ability to withstand overfitting trends and enhances its potential for real-world applications.


