Preparation and concentration performance of SAPs with ionic network
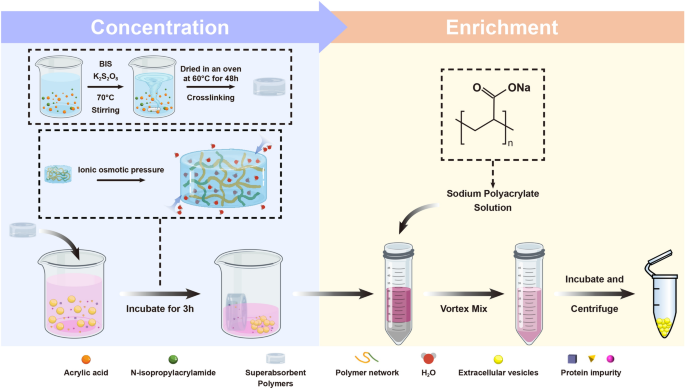
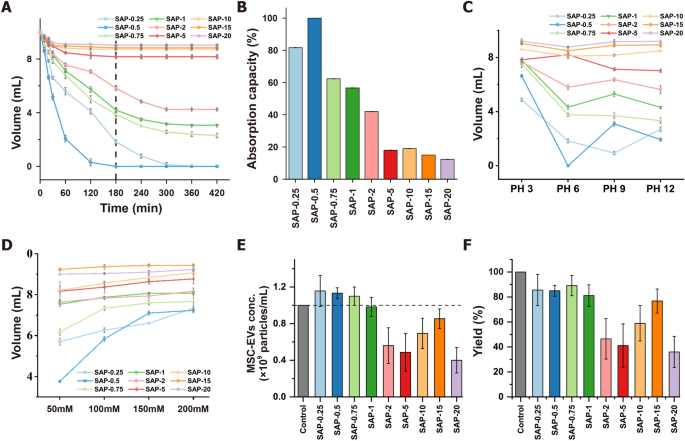
Volume reduction of CCM is necessary for the large-scale isolation of EVs. SAPs can concentrate CCM by ionic osmotic pressure-driven water absorption [20]. Water absorption efficiency of SAPs is influenced by the size of water channels formed by ion networks, which in turn is affected by salt and pH. In this study, SAPs with gradient crosslinking degrees and two monomers were prepared to optimize water absorption (Scheme 1, Table S1). The SAPs were categorized into low (SAP-0.25, SAP-0.5, and SAP-0.75), medium (SAP-1, SAP-2, and SAP-5), and high (SAP-10, SAP-15, and SAP-20) crosslinked groups based on their different crosslinking degrees. The adsorption behavior of SAPs was investigated by assessing their water volume reduction properties. The water volume decreased with increasing incubation time and reached a minimum after 180 min for different crosslinking degrees (Fig. 1A). For example, using 10 mg/mL of SAP-0.75, the average water absorption rate was 34.07 µL/min in the first 180 min, and between 180 and 420 min, it slowed to 6.53 µL/min reduced to 38.67% under these conditions. The saturation water absorption capacity of SAP-0.75 was 13.62 times that of the commercial SAPs [20]. As shown in Fig. 1B, the water absorption capacity of SAPs decreased significantly with increasing crosslinking degrees, where low crosslinked SAPs exhibited the highest adsorption capacity.
Characterization of superabsorbent polymers (SAPs) for concentrating extracellular vesicles (EVs) by using ionic network. A Water absorption and volume reduction curves of SAPs with different crosslinking degrees over time. B Water absorption capacity of different crosslinking degree SAPs. C pH-dependent water absorption and volume reduction profiles of SAPs for 180 min; D Ionic strength-dependent water absorption and volume reduction profiles of SAPs for 180 min; E Concentration capacity of SAPs in mesenchymal stem cell-derived extracellular vesicles (MSC-EVs) standard solution for 180 min. F Yield of MSC-EVs concentrated by using SAPs for 180 min
Previous studies have established that the water absorption capacity of SAPs is influenced by pH and ionic strength [20]. In this study, the pH and salt resistance of SAPs were enhanced by incorporating isopropylacrylamide into their ionic networks to copolymerize with acrylic acid (Figure S1). The swelling degree of SAPs was indeed affected by both pH and ionic strength (Fig. 1C and D). In general, low crosslinked SAPs exhibited better water absorption compared to those with medium/high crosslinking degrees. To achieve better absorption, using higher concentrations of SAPs is effective. As demonstrated in Figure S2 and S3, taking SAP-0.75 as an example, when 40 mg/mL of SAPs is utilized, the volume of a 300 mM NaCl solution still decreases to 38.83%. Additionally, for solutions with varying pH levels, over 85.67% of the solution is absorbed. These observations suggest that SAPs are efficient at absorbing water molecules, and their absorption capacity can be modulated by adjusting the degree of crosslinking, the incubation time or the concentration of SAPs. Based on these results, low crosslinked SAPs emerged as the most effective for pre-concentrating CCM before the isolation of EVs.
To assess whether SAPs affect the level of EVs in CCM during absorption and concentration, MSC-EVs isolated by UC were added to PBS and then incubated with 10 mg/mL SAPs for 180 min. The volume of the EV-containing solution decreased after absorption, resulting in a concentrated EV solution (Figure S4). NTA analysis revealed that initial EV concentration (1 × 10⁹ particles/mL) increased to over 1.1 × 10⁹ particles/mL after absorption with low crosslinked SAPs, indicating a more than 110% increase in EV concentration after a single, simple incubation step (Fig. 1E). This increase is likely due to the small water channel size of the SAPs, which is smaller than the size of MSC-EVs. However, the yield of SAP-0.25 and SAP-0.5 in the low crosslinked group was less than 86%, possibly because their water channel size is comparable to the size of MSC-EVs. In contrast, most EVs were retained in the non-absorbed solution of SAP-0.75, achieving a final EV yield of 89% post-concentration (Fig. 1F).
The adsorption capacity of SAP-0.75 for protein impurities in CCM was measured using the BCA assay. The results revealed that even as the volume of CCM decreased, the protein concentration did not increase as it did with MSC-EVs, but rather, significantly decreased (Figure S5A). Surprisingly, considering the volume change of CCM before and after concentration, the absolute amount of protein impurities dramatically reduced from 41.49 μg to 28.73 μg (Figure S5B). This simple incubation process not only increased the concentration of MSC-EVs in the CCM but also removed 30.75% of the protein impurities. We hypothesize that the observed effects are due to the size differences among the water channels of the SAPs, the MSC-EVs, and the protein impurities. Specifically, the impurities, being smaller than the water channels, were extensively adsorbed by the SAP, whereas the larger MSC-EVs were excluded. To substantiate this hypothesis, we tested whether SAP-0.75 could selectively absorb gold nanoparticles of 5 nm, 20 nm, and 100 nm in diameter. SAP-0.75 was incubated with gold nanoparticles of varying sizes for 1 h, after which the SAPs was observed. As shown in the Figure S6, SAP incubated with 5 nm and 20 nm gold nanoparticles displayed wine-red and purple colors, respectively, indicating high levels of gold nanoparticle absorption. In contrast, SAPs incubated with 100 nm gold nanoparticles remained colorless and transparent, similar to SAPs incubated with water, suggesting no absorption of the 100 nm gold nanoparticles. Based on these results, we can infer that the size-dependent adsorption capability of SAPs is responsible for the concentration of MSC-EVs and the removal of protein impurities.
Molecular dynamics simulation
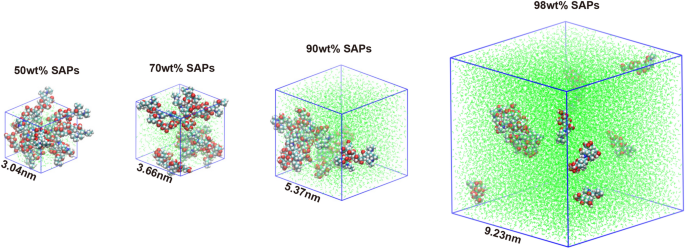
To explore the microstructure and water diffusion behavior, the polymer chain model of SAPs was designed and the fractional free volume (FFV) model of the designed polymer chain was simulated the by molecular dynamics [28] (Fig. 2). The behaviour of the FFV with respect to the simulation time is illustrated in Figure S7A. The free volume fraction increases with increasing water content due to the solubilising effect of SAPs on water uptake. The 98% saturated water content model for SAPs has the highest free volume fraction, averaging about 43%.
Utilizing molecular dynamics simulation, the number of hydrogen bonds formed between SAPs and water was quantified, in order to assess the hydration capacity of SAPs (Figure S7B). It was found that the number of hydrogen bonds between SAPs and water increased with the increasing water content. In models containing 50wt% and 70wt% water content, after 5000 ps, the number of hydrogen bonds continued to rise over time. This increase was attributed to the predominantly stable nature of bound water within SAPs. However, at higher water contents of 90wt% or 98wt%, while the initial number of hydrogen bonds remained high, a decreasing trend was observed over the simulation period. This decrease was likely due to the saturation of bound water sites and the emergence of free water molecules, which exhibit weaker binding interactions with SAPs. The interaction energy of the SAPs with water was divided into Lennard–Jones potential (LJ, nonelectrostatic force) and Coulomb potential (electrostatic force) (Figure S7C and S7D). The interaction energy for water of SAPs, was mainly provided by the electrostatic gravitational force of the Coulomb potential. The change of Coulomb potential energy of models with different water contents is consistent with the hydrogen bond over the simulation time. In other words, the hydration ability of SAPs was endowed by the charge effect that facilitates the attraction of water molecules to form more hydrogen bonds with hydrophilic groups.
Charge neutralization of sodium polyacrylate (SP) and isolation of MSC-EVs by the IOSCE
EVs are negatively charged due to their phospholipid bilayer membranes, which allows them to be aggregated and precipitated by charge-based precipitation. In this study, SP was selected to isolate MSC-EVs by charge neutralization. As shown in Figure S8, SP effectively removes water molecules surrounding the EVs, disrupting their hydration layer and increasing their hydrophobicity, which in turn leads to EV aggregation and precipitation [29, 30]. WB analysis revealed that EV markers isolated using 4% SP exhibited higher signal intensity compared to those isolated with other SP concentration (Figure S9). NTA analysis showed that MSC-EVs isolated using 4% SP had an average size of 159.5 ± 64.7 nm, with a narrower distribution range than those obtained with other concentrations, suggesting a more uniform vesicle size distribution within the samples (Figures S10, S11, Table S2). Based on these findings, 4% SP was chosen for subsequent experiments to isolate MSC-EVs in combination with SAPs concentration. Additionally, the 4% SP proved effective in separating EVs from plasma (Figure S12 and S13).
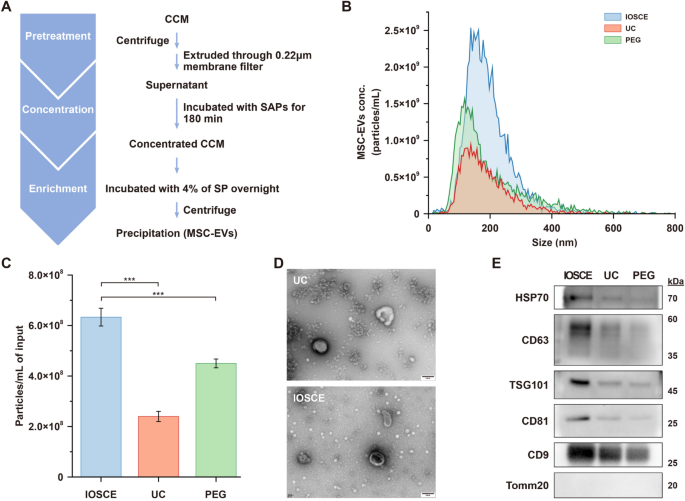
To assess our proposed IOSCE method, CCM harvested from human umbilical cord MSCs was treated with the combination of SAP-0.75 and 4% SP (Fig. 3A). This was compared to UC and PEG-based precipitation methods (20% PEG-6000) (Table S3). The median size of the isolated particles of IOSCE was 176.8 ± 75.4 nm, showing no significant difference compared to the other two methods (UC = 164.7 ± 81.5 nm; 20% PEG = 154.3 ± 115 nm), all within the size range of small EVs (Fig. 3B). The yields of the MSC-EVs isolated by IOSCE was (6.33 ± 0.35) × 108 particles/mL, which is 2.64 times and 1.4 times higher than those isolated by UC and 20% PEG, respectively (Fig. 3C). Due to the lower centrifugal force, MSC-EVs isolated by IOSCE exhibit a more typical cup-shaped morphology compared to those obtained by UC (Fig. 3D). These findings indicate that the IOSCE, effectively isolates MSC-EVs within the characteristic size range, and achieves a higher yield of MSC-EVs with more intact morphology.
Isolation of MSC-EVs by using the IOSCE, UC and PEG. A Flow chart of MSC-EVs isolation by the IOSCE. B Particle size distributions and concentration of MSC-EVs isolated by different methods from CCM. The particle concentrations have been corrected for sample input volumes. C Particle yields of each method. Particle yields have been corrected for sample input volumes. D TEM images of MSC-EVs obtained by UC and the IOSCE. Scale bars = 100 nm. E Western blots of HSP70, CD63, TSG101, CD81, CD9 and Tomm20 for MSC-EVs isolated from CCM by different methods
Moreover, the results obtained from WB also proved the same conclusion. EVs were isolated from the same volume of CCM using three different methods, and the protein contents of CD9, CD81, CD63, TSG101, HSP70 and Tomm20 were compared. As shown in Fig. 3E, the protein expression levels of canonical EV markers (CD9, CD81, CD63, TSG101 and HSP70) were significantly higher in the IOSCE methods, indicating that IOSCE can yield more EVs from the same volume of CCM. Furthermore, the absence of the negative marker (Tomm20) signal in EVs indicated the elimination of cellular impurities. To evaluate the purity of MSC-EVs enriched using the IOSCE method, we examined two key indicators: the particle-to-protein ratio and the RNA-to-protein ratio. As shown in Table S4 and S5, the MSC-EVs enriched by IOSCE had a particle-to-protein ratio of (7.22 ± 0.4) × 1010 particles/μg and an RNA-to-protein ratio of 129.5 ± 10.2 pg/μg. Compared to traditional methods such as ultracentrifugation (UC), size exclusion chromatography (SEC), and polymer precipitation, the IOSCE method achieved superior purity levels.
The IOSCE method was employed to enrich MSC-EVs from 500 mL of CCM in order to assess the scalability of this approach. As shown in Figure S14A and D, the particle size of EVs enriched from the large sample volume was within the expected nanometer range, with a characteristic cup-shaped morphology, consistent with the standards for small EVs. As depicted in Figure S14B, the MSC-EV yield was (6.43 ± 0.12) × 108/mL. Both particle size distribution and yield were consistent with the results obtained from smaller sample volumes. Moreover, we characterized the typical small EV markers, CD9, TSG101, and CD63, via WB, all of which produced clear bands, and there is no contaminating protein Tomm20, a mitochondrial marker (Figure S14C).
These findings underscore the efficacy and scalability of IOSCE for the maximal concentration of CCM and the efficient isolation of EVs, suggesting that IOSCE is a more effective method than UC and precipitation methods for isolating EVs from CCM.
Evaluation of inhibiting effect of MSC-EVs isolated by the IOSCE on LPS-induced neuroinflammation in microglial cells
In this study, the anti-inflammatory effect of MSC-EVs isolated using the IOSCE was investigated using mouse microglial cell lines (BV2 cells). Prior to this, in vitro cytotoxicity and hemolysis assays were conducted on MSC-EVs obtained via the IOSCE method to assess their safety and biocompatibility. Enriched MSC-EVs were first incubated with BV2 cells, with groups divided based on varying doses, and cell viability was monitored. As shown in Figure S15A, Calcein-AM/EthD-1 double staining revealed strong viability and growth in both the dosing and control groups, with minimal cell death (red fluorescence indicating EthD-1-staining dead cells). Furthermore, CCK-8 assays were employed to assess the effects of MSC-EVs on BV2 cell growth. As shown in the Figure S15B, BV2 cells in the dosing groups exhibited robust viability compared to the NC group, with values of 124.34 ± 8.06%, 120.67 ± 10.12%, 118.02 ± 13.04%, and 97.06 ± 3.28%, respectively. Additionally, the hemolysis assay demonstrated no observable hemolytic activity at MSC-EVs concentrations up to 60 μg/mL (Figure S15C). Taken together, these results indicate that the enriched MSC-EVs exhibit excellent biosafety, providing a solid foundation for downstream applications and the development of clinical therapies.
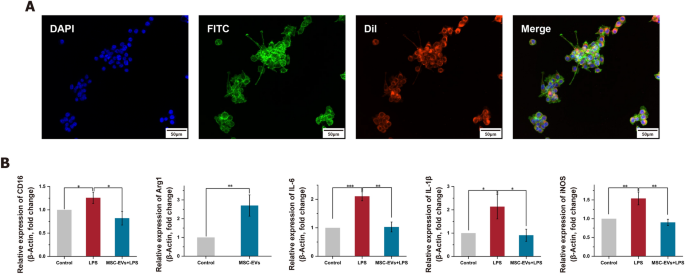
To establish a neuroinflammation model, LPS-induced BV2 cells were used, as LPS can stimulate the release of inflammatory cytokines in various cell types. The optimal therapeutic concentration of MSC-EVs was first explored. As shown in Figure S16, cell viability gradually increased as the concentration of MSC-EVs rose from 0 μg/mL to 60 μg/mL. The maximum viability was observed at a concentration of 30 μg/mL, after which there was a slight decrease. Therefore, we determined that 30 μg/mL of MSC-EVs as the optimized concentration for subsequent experiments. The MSC-EVs were effectively internalized by the BV2 cells (Fig. 4A). Microglia, as tissue-specific macrophages, share common macrophage characteristics and exist in two distinct activation states: the classical pro-inflammatory M1 state and the anti-inflammatory M2 state [31]. To elucidate the specific effect of LPS on microglial activation, the expression levels of the M1 marker (CD16) and the M2 marker (Arg1) were analyzed via qRT-PCR (Fig. 4B). The expressions of CD16 were significantly upregulated after LPS treatment, but this upregulation was significantly reduced by pretreatment with MSC-EVs (p < 0.05). Conversely, Arg1 expression showed a significant increase with MSC-EVs pretreatment (p < 0.01). These results suggest that MSC-EVs can inhibit M1 microglial polarization while promoting M2 polarization. Additionally, the levels of pro-inflammatory factors, IL-6, IL-1β and iNOS, were investigated using qRT-PCR (Fig. 4B). MSC-EVs were found to significantly reduce the release of these pro-inflammatory factors, a finding further corroborated by ELISA results (Figure S17). This comprehensive analysis indicates the potential of MSC-EVs in modulating inflammatory responses in microglial cells.
The effect of MSC-EVs isolated by IOSCE on the lipopolysaccharides (LPS)-induced neuroinflammation. A Confocal images of the internalization of DiI-labeled MSC-EVs (red) by BV2 cells. Nucleus and cytoskeleton of the BV2 cells were labeled by 4’,6-diamidino-2-phenylindole (DAPI, blue) and fluorescein isothiocyanate (FITC, green), respectively. Scale bars = 50 μm. B mRNA levels of CD16, Arg1, IL-6, IL-1β and iNOS as detected using quantitative real-time PCR. Significant differences are indicated (*p < 0.05, **p < 0.01, ***p < 0.001)
Proteomic analysis of the effects of MSC-EVs on LPS-induced neuroinflammatory response in BV2 cells
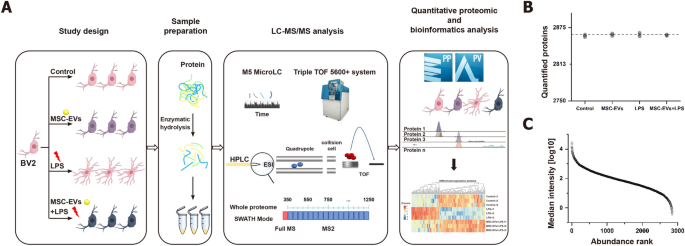
In this study, the effects of MSC-EVs on neuroinflammation were further explored by conducting a high-throughput proteomic analysis. Control, LPS-treated, MSC-EVs-treated and MSC-EVs + LPS-treated BV2 cells were identified by using DIA mass spectrometry. Data independent acquisition (DIA) was chosen for its high data completeness and robust performance (Fig. 5A). A DIA library of about 3025 proteins was computationally merged from untreated and treated samples and a direct-DIA search for all single-run samples. On average, 2863 proteins were at a 1% peptide FDR quantified per sample (Fig. 5B). The data acquired had high completeness, with 100% completeness for 2847 proteins (99.27%), 75% for 2867 proteins (99.93%), and 50% for 2867 proteins (99.97%) (Figure S18). A total of 2847 proteins present in all runs were used in the subsequent analyses. The relative abundance of the quantified proteins (normalized as iFOT) spanned six orders of magnitude after logarithmic transformation, which reflected the deep sequencing coverage (Fig. 5C, Figure S19).
Study design and proteome characterization of the effects of MSC-EVs on LPS-induced neuroinflammatory response in BV2 Cells. A Overview of the study groups and schematic proteomic workflow. B Number of proteins identified and quantified passing the 1% false discovery rate (FDR) cutoffs in each sample. The dashed line indicates the mean of the quantified proteins. C Median protein abundance distribution of quantified proteins based on iFOT intensities
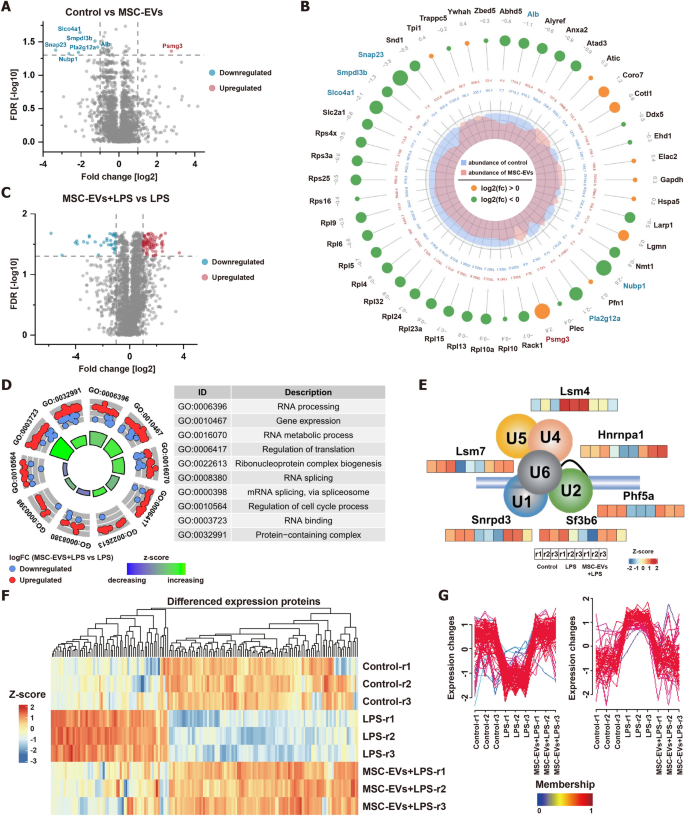
Subsequently, the impact of MSC-EVs on BV2 cells were assessed by differential expression analysis. Remarkably, exhibited no significant change, with only 7 proteins showing significant alterations [FDR < 0.05, Fold change (FC) > 2] (Fig. 6A). Notably, proteins in the NF-κB pathway, crucial in cellular response to stimuli, showed no significant changes. However, the negative regulator of this pathway, smpdl3b, was downregulated (Fig. 6B). The protein Psmg3, known to be downregulated in response to INF-γ and related to inflammatory responses, was significantly upregulated in MSC-EVs internalized by BV2 cells, suggesting a potential anti-inflammatory role. This aligns with our phenotypic observations of an increase in M2-type BV2 cells, indicating that MSC-EVs minimally affect protein expression in BV2 cells and may promote an anti-inflammatory state.
Differential proteomic analysis and bioinformatics analysis of the impact of MSC-EVs on BV2 cells. A Volcano plot for quantitative proteins between control and MSC-EVs-treated BV2 cells. The horizontal dashed line shows an FDR of 0.05. The vertical dashed lines show a fold change (FC) of 2. B The differentially expressed proteins on control and MSC-EVs-treated BV2 cells (FDR < 0.05). The bigger circle, the greater the differential expression level. Out to inner numbers in circles represented logarithmic values of the fold changes and the expression levels of group control and MSC-EVs-treated BV2 cells. C Volcano plot for quantitative proteins between MSC-EVs + LPS-treated and LPS-treated BV2 cells. The horizontal dashed line shows an FDR of 0.05. The vertical dashed lines show an FC of 2. D GO enrichment analysis on differentially expressed proteins between MSC-EVs + LPS-treated and LPS-treated BV2 cells. E The protein expression levels of six spliceosomal proteins of control, LPS-treated, and MSC-EVs + LPS-treated BV2 cells. F The heatmap analysis of differential proteins between LPS vs. control and MSC-EVs + LPS vs. LPS. G The Mfuzz analysis of differential proteins between LPS vs. control and MSC-EVs + LPS vs. LPS
Further differential protein analysis was conducted to evaluate the effects of LPS on BV2 cells and the anti-inflammatory potential of MSC-EVs. 105 proteins were significantly changed after LPS stimulation (FDR < 0.05, FC > 2) (Figure S20), predominantly related to RNA metabolic processes and regulation of translation (Figure S21). By comparing the protein expression profiles of LPS-stimulated BV2 cells pretreated with and without MSC-EVs, 113 proteins were significantly changed (FDR < 0.05, FC > 2) (Fig. 6C). Interestingly, the expression of functionalized differential proteins was also related to RNA metabolic process and regulation of translation, similar to the biological processes involved in differential proteins in BV2 cells before and after LPS stimulation (Fig. 6D). Notably, MSC-EVs effectively countered significant LPS-induced alterations in RNA metabolism and transcriptional regulatory proteins (Figure S22). For example, MSC-EVs restored normal levels of six spliceosomal proteins involved in RNA splicing (Fig. 6E). A combined analysis of differential proteins between LPS vs. control and MSC-EVs + LPS vs. LPS through heatmap and Mfuzz analyses revealed that MSC-EVs broadly offset LPS-induced protein changes (Fig. 6F and G). Consequently, MSC-EVs appear to restore cells to their baseline state by reversing LPS-induced alterations in biological processes, emphasizing their potential in RNA metabolism and translational regulation modulation.


