Photo-controlled co-delivery of Vp and Af via platelets achieved potentiated GBM PDT
Characterization of Vp@Plt, Af@Plt, Vp@Plt + Af@Plt, and (Vp + Af)@Plt
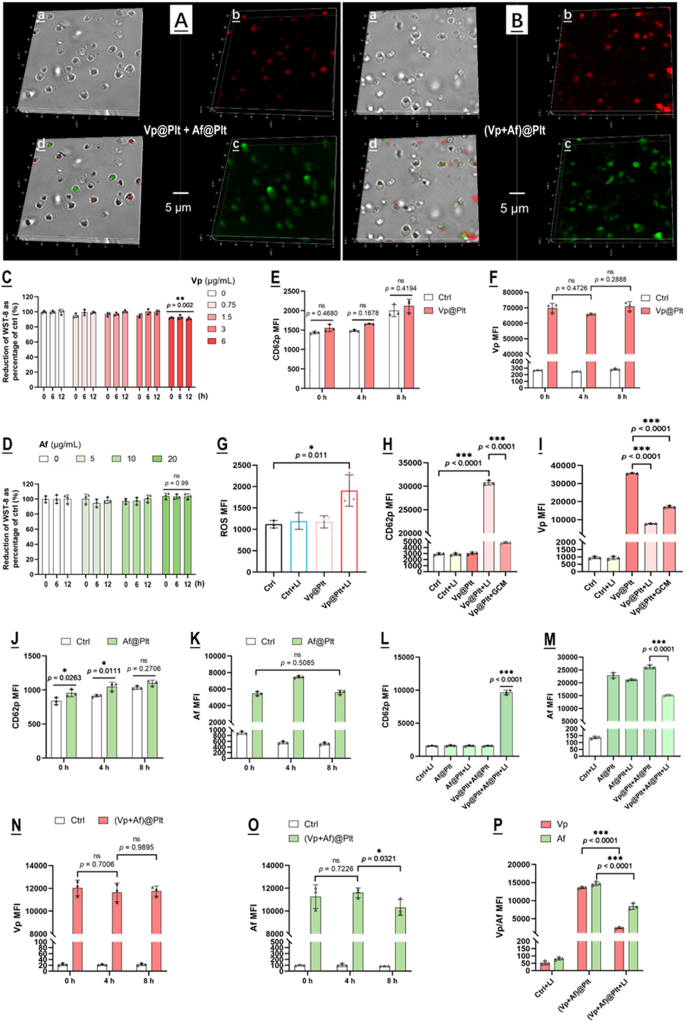
Vp@Plt and Af@Plt were prepared by incubating isolated mouse platelets (106/mL) separately with Vp (3 µg/mL in PBS) and Af (10 µM in PBS) for 30 min. (Vp + Af)@Plt were prepared by incubating mouse platelets with a mixture of Vp (3 µg/mL) and Af (10 µM) in PBS for 30 min. The uploading of Vp, Af, and Vp + Af were confirmed by confocal microscopy (Fig. 1A, B). Vp@Plt only exhibited Vp-derived fluorescence and Af@Plt only exhibited Af-derived fluorescence while (Vp + Af)@Plt exhibited both Vp- and Af- derived fluorescence at the same time (Fig. 1A, B). The non-toxic loading concentration for Vp (3 µg/mL) and Af (10 µM) were determined using the CCK-8 test to assay the viability of platelets after incubation with Vp or Af across a range of concentrations (Fig. 1C, D). Under these conditions, loading efficiency was 0.48 µg/106 platelets for Vp and 0.25 µg/106 platelets for Af. Vp@Plt were quite stable within 8 h of preparation showing no significant sign of activation and spontaneous release as indicated by the expression of surface CD62p and cellular Vp fluorescence (Fig. 1E, F). Upon LI (690 nm, 0.5 W/cm2, 60 s), Vp@Plt exhibited a spike of ROS generation with concurrent platelet activation and rapid loss of Vp (Fig. 1G-I). Notably, the GBC-conditioned culture medium (GCM) could also induce Vp@Plt activation and discharge of Vp, albeit to a much lesser extent (Fig. 1H, I). On the other hand, Af@Plt also maintained stability within 8 h of preparation without activation and spontaneous release (Fig. 1J, K). Neither LI (690 nm) nor mixing with Vp@Plt had any remarkable effect on Af@Plt (Fig. 1L, M). However, LI (690 nm) on the mixture of Vp@Plt + Af@Plt effected marked platelet activation and rapid loss of Af from the Af@Plt (Fig. 1L, M). Similarly, (Vp + Af)@Plt remained stable showing little sign of platelet activation and spontaneous offloading within 8 h of preparation but exhibited a marked loss of Vp and Af upon LI (690 nm) (Fig. 1N-P).
Characterization of Vp@Plt, Af@Plt, Vp@Plt + Af@Plt, and (Vp + Af)@Plt. A & B: Confocal microscopy of Vp@Plt + Af@Plt, and (Vp + Af)@Plt. Vp fluorescence (red) was observed in the Cy5 channel with 650 nm excitation and emission at 670 nm. Af fluorescence (green) was observed in the FITC channel with 488 nm excitation and emission at 520 nm. a: Bright field. b: Vp-derived fluorescence. c: Af-derived fluorescence. d: Merge of a, b, and c. C&D: Platelets incubated with Vp and Af at a range of concentrations were maintained in PBS and aliquots of the loaded platelets were taken at different time points for viability assay. E Spontaneous activation of Vp@Plt over time, indicated by surface CD62P expression. F: Spontaneous offloading from Vp@Plt over time, indicated by intracellular Vp content. G: ROS generation in the Vp@Plt upon LI (690 nm). H: Activation of Vp@Plt by LI (690 nm) and GBC-conditioned culture medium (GCM). I: Offloading from Vp@Plt triggered by LI (690 nm) and GCM. J: Spontaneous activation of Af@Plt over time, indicated by surface CD62P expression. K: Spontaneous offloading from Af@Plt over time, indicated by intracellular Af content. L: Activation of Vp@Plt + Af@Plt by LI (690 nm). M: LI (690 nm) triggered offloading of Af@Plt in mixture with Vp@Plt but not Af@Plt solo. N&O: Spontaneous offloading from (Vp + Af)@Plt over time, indicated by intracellular Vp and Af content. P: LI (690 nm) triggered offloading of (Vp + Af)@Plt. Values are means ± standard deviation (SD) (n = 3, *p < 0.05, **p < 0.01, ***p < 0.001). Representative flow cytometry contour plots for E-P are presented in Fig. S2
Photo-triggered, GBM-targeted delivery mediated by Vp@Plt, Vp@Plt + Af@Plt, and (Vp + Af)@Plt
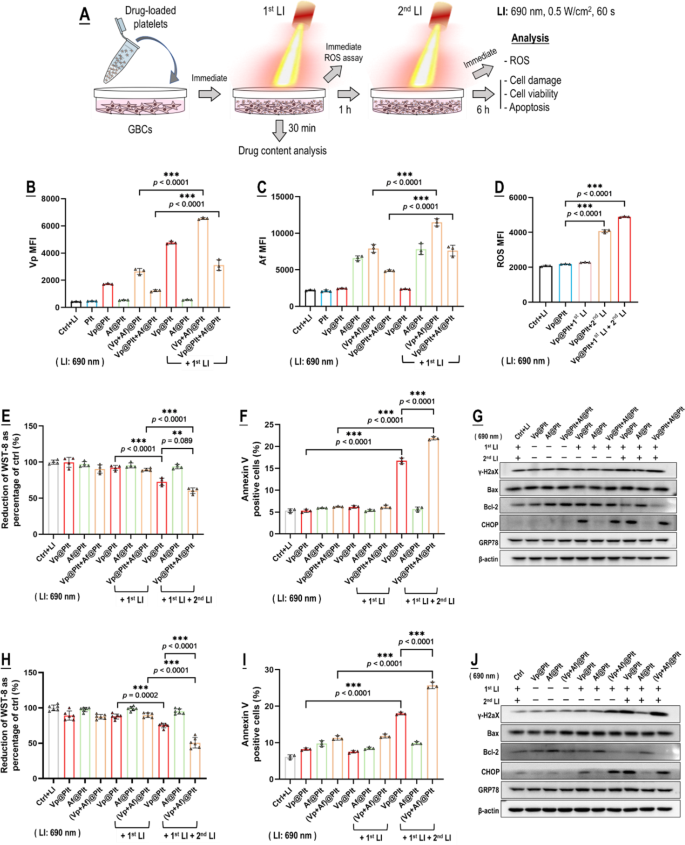
We next demonstrated photo-controlled drug delivery from Vp@Plt, Vp@Plt + Af@Plt, and (Vp + Af)@Plt to in vitro mouse GBCs (GL261) per an experimental protocol shown in Fig. 2A. Working concentration was 0.48 µg/mL for Vp and 0.25 µg/mL for Af. The GBCs only displayed a low content of Vp, Af, Vp + Af, and Vp + Af following 1 h of treatment of Vp@Plt, Af@Plt, Vp@Plt + Af@Plt, and (Vp + Af)@Plt, respectively (Fig. 2B, C), likely due to a low level of platelet activation and drug release elicited by the GBCs (Fig. 1H, I). In contrast, LI (690 nm, 0.5 W/cm2, 60 s) at the outset of the treatment resulted in sharply increased drug contents in all groups of GBCs but those treated with Af@Plt (Fig. 2B, C), indicating the occurrence of LI-triggered delivery of Vp and co-delivery of Vp & Af to the GBCs from the loaded platelets. The lack of LI-triggered drug delivery by Af@Plt alone (Fig. 2C) is reasonable as LI (690 nm) does not excite Af. Next, the GBCs that had been treated with Vp@Plt exhibited pronounced ROS generation upon a second LI 1 h after the first LI (Fig. 2D), which led to significant cytotoxicity manifested as cell viability loss (WST-8), DNA damage (γH2AX), ER stress (CHOP, GRP78), and apoptosis (Annexin V, Bax & Bcl-2) (Fig. 2E-J). Significantly, photo-controlled co-delivery of Vp and Af by way of Vp@Plt + Af@Plt (Fig. 2E-G) and (Vp + Af)@Plt (Fig. 2H-J) both led to markedly enhanced photo-cytotoxicity over Vp@Plt.
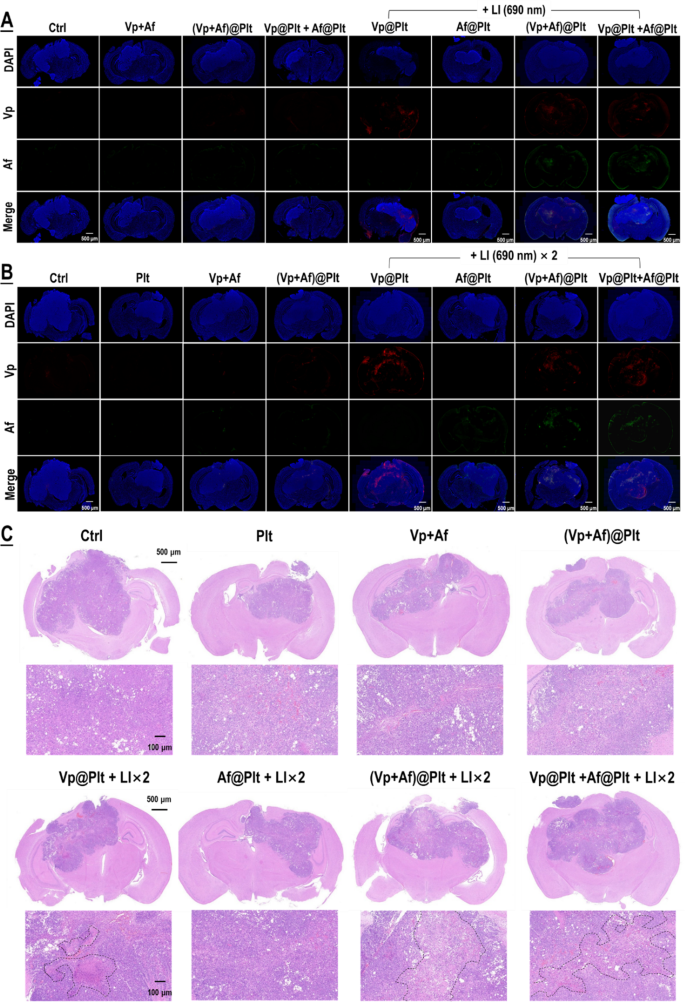
The in vitro results were then validated in mice bearing intra-cranial grafted GBMs per protocols shown in Fig. S4. The animals, according to their assignments, were each given an intravenous bolus injection of Vp@Plt, Af@Plt, (Vp + Af)@Plt, or Vp@Plt + Af@Plt, in 200 µL of PBS. The dosage was 24 µg/kg for Vp and 12.5 µg/kg for Af. After a drug-to-light interval of 1 h, two extra-cranial LI (690 nm, 0.5 W/cm2, 60 s) were applied to each animal at the tumor site at a 2-hr interval. The first LI was meant to induce GBM-targeted, photo-controlled drug delivery and the second LI was for activation of the Vp distributed in the tumor and thereby elicitation of photodynamic damage of the tumor. As shown in Fig. 3A, all animals but those injected with Af@Plt exhibited remarkable drug distribution in the GBMs 2 hrs after the first LI. Notably, the mice injected with Vp@Plt only displayed Vp fluorescence in the GBMs while the mice injected with either (Vp + Af)@Plt or Vp@Plt + Af@Plt displayed both Vp and Af fluorescence in the GBMs, indicating successful co-delivery of the two agents. The lack of Af distribution in the GBMs in the Af@Plt-injected mice is in keeping with the in vitro observation shown in Fig. 2C, which are both ascribed to the fact that Af is not excited by LI (690 nm). Further along, increased drug fluorescence indicating accumulation of delivered drug was observed in all animals but those injected with Af@Plt 24 h after the second LI (Fig. 3B). In agreement with the drug delivery profiles, the mice that had received (Vp + Af)@Plt or Vp@Plt + Af@Plt exhibited more massive and severe tissue necrosis in the GBMs than those that received Vp@Plt 24 h after the second LI, indicating that the co-delivered Af enhanced Vp-mediated photo-damage of the GBMs (Fig. 3C). By contrast, none of the control animals that had received an intravenous injection of Vp + Af, or (Vp + Af)@Plt, or Vp@Plt + Af@Plt but without LI displayed significant drug distribution, accumulation (Fig. 3A, B), and massive tissue necrosis (Fig. 3C) in the GBMs. Nor did the mice that had received the Af@Plt injection plus LI present massive tissue necrosis in the GBMs they were carrying (Fig. 3C).
Photo-triggered drug delivery from Vp@Plt, Vp@Plt + Af@Plt, and (Vp + Af)@Plt to in vitro GBCs and subsequent photocytoxicity. A: Experimental protocol. Briefly, Vp@Plt, Af@Plt, Vp@Plt + Af@Plt, and (Vp + Af)@Plt were separately mixed with GL261 cells and the mixture received two LI (690 nm, 0.5 W/cm2, 60 s) at an interval of 1 h. The GL261 cells were taken out for analysis at indicated time points. B&C: Vp and Af contents in the GL261 cells after the first LI, assayed by flow cytometry. D: ROS generation in the GL261 cells upon the 1st and 2nd LI. E–G: Photo-cytotoxicity of Vp@Plt + Af@Plt vs. Vp@Plt and Af@Plt indicated by WST-8 test, annexin v staining, and expression of γH2AX, Bax, Bcl-2, CHOP, and GRP78. H–J: Photo-cytotoxicity of (Vp + Af)@Plt vs. Vp@Plt and Af@Plt indicated by WST-8 test, annexin v staining, and expression of γH2AX, Bax, Bcl-2, CHOP, and GRP78. Values are means ± standard deviation (SD) (n = 3, *p < 0.05, **p < 0.01, ***p < 0.001). Representative flow cytometry contour plots for E-P are presented in Fig. S3. Quantitative analysis of Western blot data in G & J is shown in Fig. S12 & Fig. S13 in the supplement information
Photo-triggered, GBM-targeted drug delivery by Vp@Plt, Vp@Plt + Af@Plt, and (Vp + Af)@Plt and subsequent phototoxicity to the GBM. Experimental protocol is shown in Fig. S3. Briefly, intracranial GBM-bearing mice were intravenously injected with Vp@Plt, Af@Plt, Vp@Plt + Af@Plt, or (Vp + Af)@Plt and, 1 h later, received 2 LI (690 nm, 0.5 W/cm2, 60 s) at the tumor site at a 2-hr interval. Part of the animals were sacrificed 2 hr after the 1st LI and the rest sacrificed 24 h after the 2nd LI. The brains were taken for fluorescent staining, H&E staining and microscopy. A: Vp and Af fluorescence in the GBMs 2 hr after the 1st LI. B: Vp and Af fluorescence in the GBMs 24 h after the 2nd LI. C: H&E staining of the brain and GBM tissues harvested 2 hr after the 1st LI and 24 h after the 2nd LI. Areas circled in the dotted lines are tissues with severe necrosis. Representative higher magnification confocal fluorescent microscopic images of are presented in Fig. S5 & S6
Vp@Plt + Af@Plt and (Vp + Af)@Plt achieved more potent GBM-targeted PDT than Vp@Plt
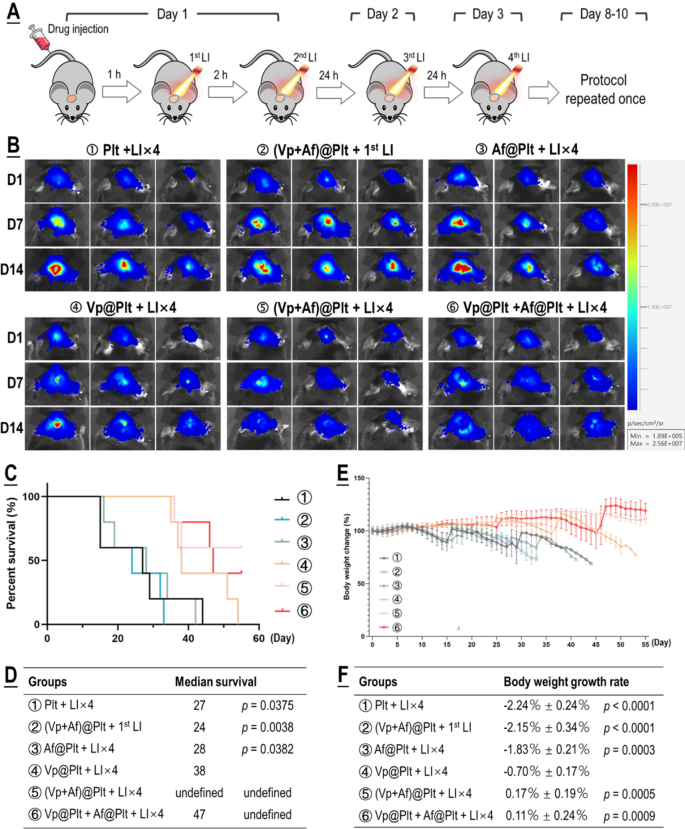
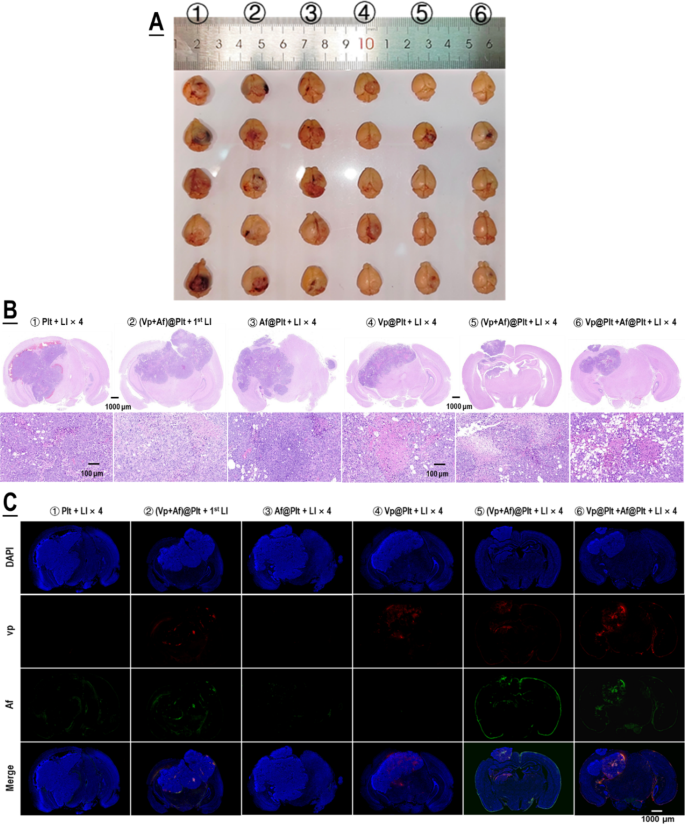
For evaluation of therapeutic efficacy, mice bearing intra-cranial grafted GBMs were treated per a protocol illustrated in Fig. 4A. Briefly, the GBM-bearing mice which were divided into six groups, according to their assignments, were each given an intravenous bolus injection of ②Plt, ②(Vp + Af)@Plt, ③Af@Plt, ④Vp@Plt, ⑤(Vp + Af)@Plt, or ⑥Vp@Plt + Af@Plt, in 200 µL of PBS. The dosage was 24 µg/kg for Vp and 12.5 µg/kg b.w. for Af. After a drug-to-light interval of 1 h, the animals in groups ②, ③, ④, ⑤, and ⑥ each received 2 LI (690 nm, 0.5 W/cm2, 60 s) at the tumor site at a 2-hr interval. Two further LI were performed, one 24 h and the other 48 h after the second LI. The animals in group ② only received the first LI 1 h after drug injection. The first LI was meant for GBM-targeted, photo-triggered drug delivery and all the other LI were for activation of the Vp distributed in the tumor and thereby elicitation of photodynamic damage of the tumor. The treatment protocol was performed twice at an interval of 5 days. As shown in Fig. 4B-F, Vp@Plt- mediated PDT (Vp@Plt + LI×4, group ④) showed remarkable anti-GBM efficacy with such manifestations as markedly slowed tumor growth, significant extension of host survival, and much alleviated body weight loss. More importantly, both (Vp + Af)@Plt (group ⑤) and Vp@Plt + Af@Plt (group ⑥) achieved tangibly higher therapeutic efficacy than Vp@Plt (group ④). Particularly, 3 out of the 5 animals in group ⑤ that received (Vp + Af)@Plt + LI×4 and 2 out of the 5 animals in group ⑥ that received Vp@Plt + Af@Plt + LI×4 were still alive at the end of the experiment by which time all otherwise treated animals had already been lost. In contrast, neither (Vp + Af)@Plt + 1st LI (group ②) nor Af@Plt + LI×4 (group ④) exhibited appreciable therapeutic efficacy. Furthermore, gross examination of resected brains showed smaller tumor growths and significantly better preserved brain morphology in groups ④, ⑤ and ⑥ (Fig. 5A). H&E staining also revealed massive tissue necrosis in the tumor grafts in groups ④, ⑤ and ⑥, and there was no apparent brain tissue damage (Fig. 5B). Remarkably, tumor grafts in groups ②, ④, ⑤ and ⑥, at the time of host sacrifice which was 25 days after the last time of drug administration, still displayed appreciable drug retention as indicated by the drug-derived fluorescence (Fig. 5C). These observations are compelling proof that (1) photo-controlled delivery of Vp via Vp@Plt achieved efficacious anti-GBM PDT, (2) photo-controlled co-delivery of Vp and Af, either through (Vp + Af)@Plt or Vp@Plt + Af@Plt achieved more potent anti-GBM PDT than Vp@Plt.
Anti-GBM efficacy of PDT mediated by photo-activated Vp@Plt, Vp@Plt + Af@Plt, and (Vp + Af)@Plt. A: Experimental protocol. Briefly, five groups of GBM-bearing animals were intravenously injected with platelets (Plt), Af@Plt, Vp@Plt, (Vp + Af)@Plt, and Vp@Plt + Af@Plt, respectively (①③④⑤⑥). The animals were then subjected to a succession of 4 LI (0.5 W/cm2, 60 s) at intervals at the tumor site. The treatment protocol took 3 days to complete and was repeated once. As control, another group of animals were injected with (Vp + Af)@Plt and only received the 1st LI (②). B: Fluorescent images of brain tumors in vivo taken on day 1, 7, and 14 into therapy. GBM-derived luminescence on day 1 and the increase in GBM-derived luminescence up to day 14 was quantified and showed in Fig. S7. C & D: Survival analysis of treated animals. E & F: Body weight of treated animals monitored over the therapy duration. Body weight growth rates were calculated by regression analysis. Values were means ± SD (n = 5)
Both Af and Vp could potentiate GBM PDT through blocking PDT-induced interaction of HIF-1α and YAP in GBCs
Both Af and Vp potentiated photodynamic toxicity in GBCs
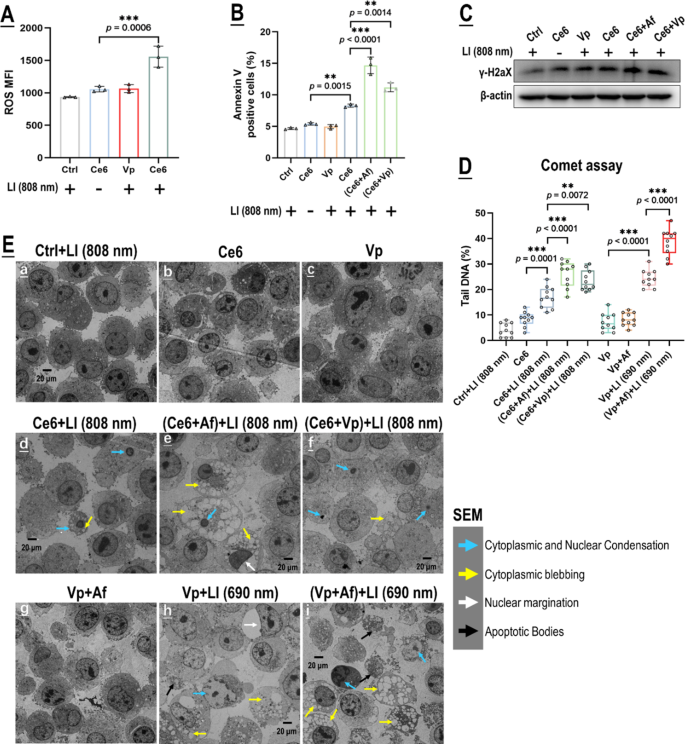
We next set out to demonstrate our original mechanistic hypothesis that Af might potentiate the photo-cytotoxicity of Vp-mediated PDA through blocking the induced HIF-1α. Vp, however, has pharmacological activities (e.g. inhibition of YAP) [38, 39] that would likely bear on its photo-cytotoxicity and the activity of Af. Considering this possibility, we adopted another photosensitizer, chlorin e6 (Ce6) plus 808 nm of excitation light (Ce6 + LI(808)) in parallel with Vp + LI(690 nm) in the mechanistic study. We had previously demonstrated that Ce6 can be excited by LI(808 nm) which does not excite Vp [37]. Herein, as shown in Fig. 6A, Ce6 generated ROS in the GBCs under LI(808 nm) but Vp did not. Af as expected potentiated Ce6’s photo-toxicity to the GBCs under LI(808 nm), as was indicated by a marked increase in DNA damage (γH2X & comet assay) and apoptosis (surface annexin v) (Fig. 6B-D). Surprisingly, Vp also potentiated the photo-cytotoxicity of Ce6 under LI(808 nm) (Fig. 6B-D). TEM provided further evidence that both Af and Vp enhanced GBC apoptosis induced by Ce6 + LI(808 nm) (Fig. 6E). These findings suggest that (1) Vp has non-photosensitizing effects that might potentiate the photo-toxicity of itself and other photosensitizers; and (2) the potentiative action of Af might not be limited to Vp-mediated PDA but also apply to other photosensitizers.
Both Af and Vp potentiated the photo-toxicity of Ce6 under LI (808 nm). A: Ce6 but not Vp generated ROS under LI (808 nm) in in vitro GL261 cells. Effect of Vp, Ce6, Ce6 + Af, and Ce6 + Vp under LI (808 nm) on cell surface annexin v expression (B), γH2AX (C), DNA damage indicated by the comet assay (D), and cell morphology observed via SEM (E). Representative flow cytometry contour plots for A & B are shown in Fig. S9 A & B. Comet assay images for D are shown in Fig. S9C
PDA induced HIF-1α, which both could be suppressed by Af and Vp
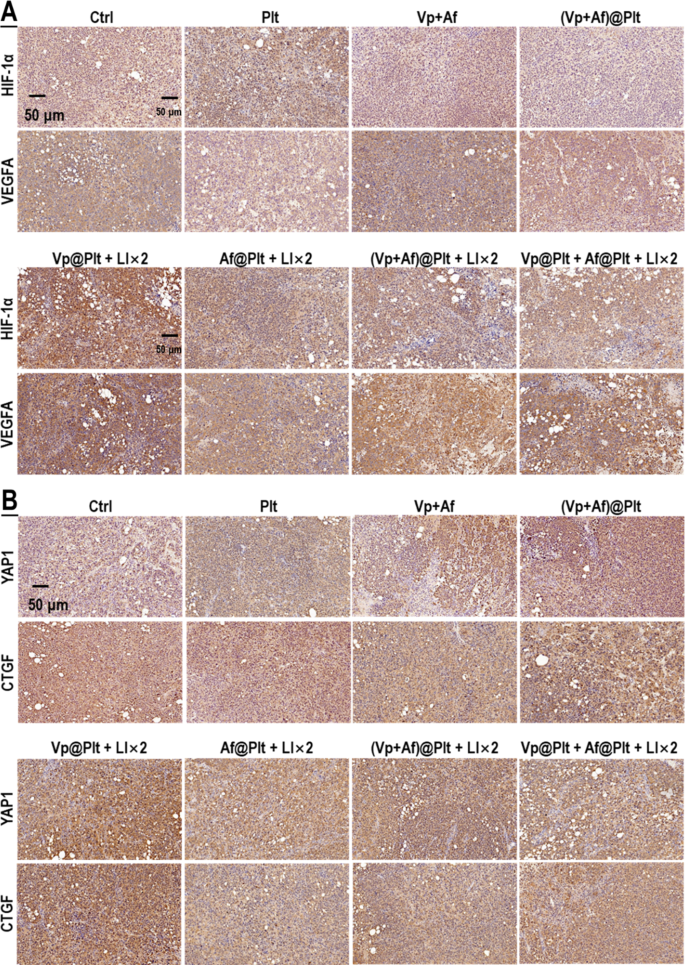
As mentioned above, our initial hypothesis was that Af might potentiate the photo-cytotoxicity of Vp + LI(690 nm) through repressing the induced HIF-1α. Thus, to begin with, we examined the effect of Af on the gene transcription (mRNA level), protein content, degradation activity (indicated by the levels of PHD2 and P-VHL) of HIF-1α, and its downstream targets in in vitro GBCs following exposure to Vp + LI (690 nm). CoCl2, a widely used hypoxia-mimicking agent that increases HIF-1α by inhibiting the PHD [40], was used for control. As shown in Fig. 7A, HIF-1α mRNA level showed little change following exposure to Vp + LI(690 nm). Paradoxically, there was an obvious increase of HIF-1α protein and its downstream targets (VEGFA, GLUT1, & CA9) (Fig. 7B-E). This apparent inconsistency could only be attributed to decreased HIF-1α degradation as was indeed indicated by a reduction in PHD2 and P-VHL, the principal enzymes responsible for HIF-1α degradation (Fig. 7F). Af, as expected, alleviated the upregulation of HIF-1α and its downstream targets induced by Vp + LI (690 nm) (Fig. 7E). CoCl2 also upregulated HIF-1α and its downstream targets (Fig. 7E) with consistently decreased PHD2 and P-VHL (Fig. 7F) and these effects were not only alleviated by Af but, interestingly, also by Vp (Fig. 7E, F). This observation suggests that Vp may have non-photosensitizing effects on the PDA-induced HIF-1α and this assumption was substantiated by the use of Ce6 + LI(808 nm). As shown in Fig. 7G-K, Ce6 + LI(808 nm), like Vp + LI(690 nm), had little effect on HIF-1α mRNA level but resulted in a remarkable increase in HIF-1α protein and its downstream targets (VEGFA & CA9), as well as decreased PHD2 and P-VHL indicative of diminished HIF-1α degradation. Significantly, both Af and Vp markedly suppressed the upregulation of HIF-1α protein and its downstream targets with little bearing on HIF-1α mRNA (Fig. 7G-J), and this effect was accompanied by an increase in P-VHL indicating recovered HIF-1α degradation (Fig. 7K). The in vitro results were well reflected in the in vivo orthotopic GBMs exposed to Vp@Plt + LI (690 nm), which exhibited enhanced expression of HIF-1α and VEGFA, which was alleviated by Af delivered either in the form of (Vp + Af)@Plt or Vp@Plt + Af@Plt (Fig. 8A). To recap briefly, PDA induced HIF-1α by reducing its degradation rather than upregulating its gene transcription, and this effect could be antagonized by both Af and Vp leading to increased HIF-1α degradation.
Both Vp and Af suppressed HIF-1α induction caused by Vp under LI (690 nm) or Ce6 under LI(808 nm). Effect of Vp and Af on mRNA levels of HIF-1α (A), VEGFA (B), GLUT1 (C), and CA9 (D), their protein levels (E), and levels of HIF-1α degradation enzymes PHD2 and P-VHL(F) in G261 cells exposed to PDA mediated by Vp under LI(690 nm). CoCl2 was used as a control treatment in A–F. Effect of Vp and Af on mRNA levels of HIF-1α (G), VEGFA (H), and CA9 (I), their protein levels (J), and levels of HIF-1α degradation enzymes PHD2 and P-VHL (K) in G261 cells exposed to PDA mediated by Ce6 under LI (808 nm). Values were means ± SD (n = 3, *p < 0.05, **p < 0.01, ***p < 0.001). Quantitative analysis of Western blot data in F is shown in Fig. S14 in the supplement information
Af delivered in the form of (Vp + Af)@Plt and Af@Plt + Vp@Plt both suppressed the induction of HIF-1α and YAP caused by Vp@Plt under LI (690 nm) in intracranial GBM tissues. Experimental protocol is shown in Fig. S4. Briefly, intracranial GBM-bearing mice were intravenously injected with Vp@Plt, Af@Plt, Vp@Plt + Af@Plt, or (Vp + Af)@Plt and, 1 h later, received 2 LI (690 nm, 0.5 W/cm2, 60 s) at the tumor site at a 2-hr interval. The animals were sacrificed 24 h after the 2nd LI. The brains were taken for immunohistochemical (IHC) staining of HIF-1α, VEGFA (A), YAP, and CTGF (B)
PDA induced YAP, which could both be suppressed by Vp and Af
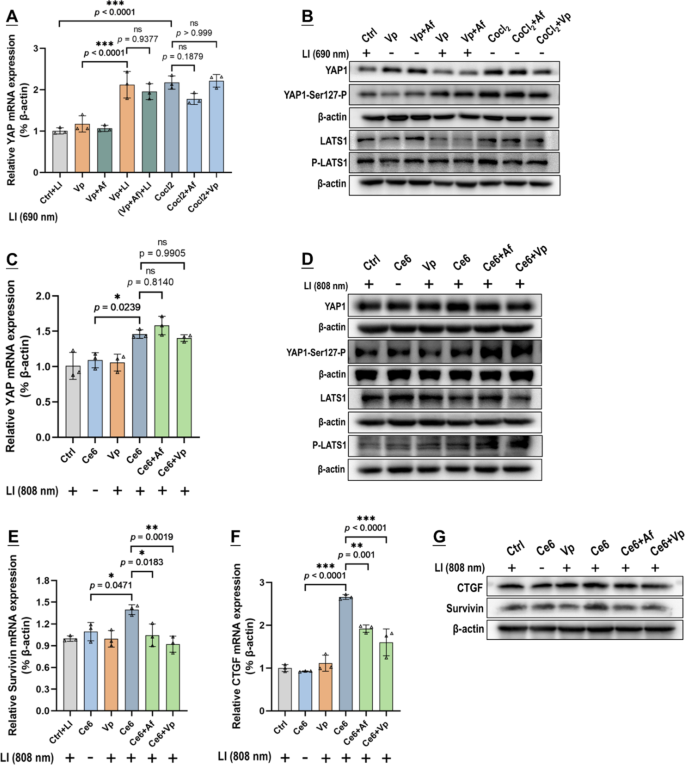
In light of the above observations and the fact that Af is a recognized HIF-1α inhibitor and Vp is a well-known YAP inhibitor [25, 26], we suspected that PDA might induce an interplay of HIF-1α and YAP in the GBCs. To explore this notion, we surveyed the gene transcription (mRNA level), protein content, and degradation activity of YAP in in vitro GBCs exposed to PDA. Under Vp + LI (690 nm), there was an upsurge in YAP mRNA but, paradoxically, no increase in YAP protein (Fig. 9A & B). This inconsistency could only be explained by increased YAP degradation which was clearly indicated by a marked increase in YAP-Ser127-P and P-LATS1 (Fig. 9B). (Note: P-LATS1 is the activated formed of LATS1, which triggers YAP phosphorylation at Ser127 (YAP-Ser127-P), resulting in cytoplasmic retention and degradation [41]). Vp, an agent known to promote YAP degradation [38, 39], was strongly indicated to be the actor underlying the decreased YAP protein by another two lines of evidence. First, Vp alleviated CoCl2-induced YAP protein level without affecting YAP mRNA (Fig. 9A & B). Second, Ce6 + LI(808 nm) also induced YAP and its downstream targets (Survivin & CTGF) as well and Vp alleviated the induced protein level of YAP and its downstream targets without affecting YAP mRNA (Fig. 9C-G). Significantly, Af also repressed the induced YAP protein level and its downstream targets without affecting YAP mRNA (Fig. 9C-G), and both Vp and Af resulted in heightened YAP degradation as was indicated by a marked increase in YAP-Ser127-P and P-LATS1 (Fig. 9D). The orthotopic GBMs displayed enhanced YAP and CTGF expression following exposure of Vp@Plt + LI (690 nm) (Fig. 8B), which appeared to be inconsistent with the observed YAP decrease in in vitro GBCs (Fig. 9B). This inconsistency, as is discussed later, is attributed to the aggravated hypoxia in the tumor tissue as a result of PDT. Notwithstanding, the enhanced YAP and CTGF expression was alleviated by Af delivered either in the form of (Vp + Af)@Plt or Vp@Plt + Af@Plt (Fig. 8B), which is in keeping with the in vitro findings. To recap briefly, PDA induced YAP via upregulating its gene expression, which effect could be antagonized both by Vp and Af leading to increased YAP degradation.
A synthesis of the findings in subsections 2.2 and 2.3 suggest that PDA might induce an interplay of HIF-1α and YAP, which begins with heightened YAP gene transcription and leads to reduced degradation of both factors; both Af and Vp could block this interaction therefore increasing the degradation of HIF-1α and YAP. There has been study suggesting that HIF-1α can physically interact with YAP in cancer and non-cancer cells under hypoxic stress, promoting the functions of both factors [34, 42, 43]. We wondered PDA might induce a similar interaction in GBCs and found relevant evidence which is presented below.
Both Vp and Af suppressed YAP induction caused by Vp under LI (690 nm) or Ce6 under LI(808 nm). Effect of Vp and Af on YAP mRNA level (A), protein levels of YAP, YAP-Ser127-P, LATS1, and P-LATS1 (B) in G261 cells exposed to PDA mediated by Vp under LI (690 nm). CoCl2 was used as a control treatment in A & B. Effect of Vp and Af on YAP mRNA level (C), protein levels of YAP, YAP-Ser127-P, LATS1, and P-LATS1 (D), mRNA levels of Survivin (E) and CTGF (F), and their protein levels (G) in G261 cells exposed to PDA mediated by Ce6 under LI(808 nm). (n = 3, *p < 0.05, **p < 0.01, ***p < 0.001). Quantitative analysis of Western blot data in B & D is shown in Fig. S15 in the supplement information
PDA elicited an interplay of HIF-1α and YAP which could both be blocked by Af and Vp
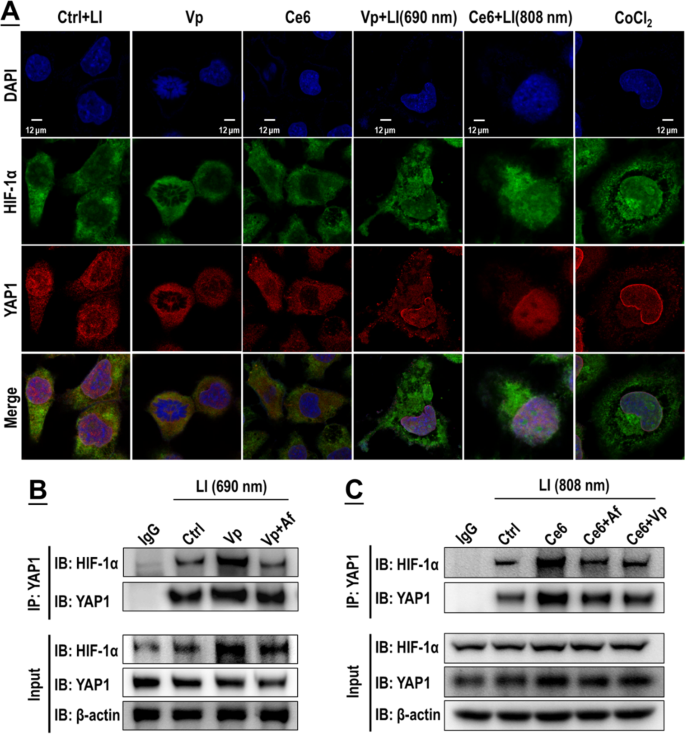
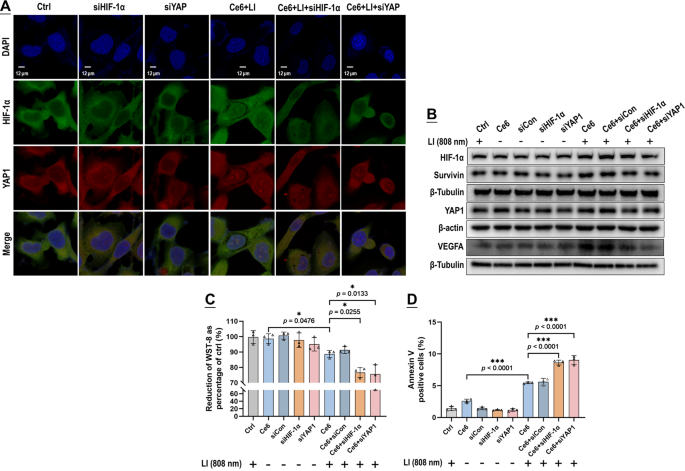
The GBCs exhibited a conspicuous nuclear co-localization of HIF-1α and YAP following exposure of Vp + LI (690 nm), or Ce6 + LI (808 nm), or CoCL2 (Fig. 10A). Co-IP assay also identified increased binding of HIF-1α and YAP both under Vp + LI (690 nm) and Ce6 + LI (808 nm), which could be both suppressed by Vp and Af (Fig. 10B, C). Notably, the Co-IP assay also demonstrated the changes in HIF-1α and YAP protein levels at the same time following exposure to PDA (Fig. 10B, C). Both Vp + LI (690 nm) and Ce6 + LI (808 nm) triggered an increase of HIF-1α which could be alleviated by AF. But YAP behaved differently. Under Vp + LI (690 nm), the YAP level declined, which was ascribed to Vp-mediated degradation and compounded by the addition of Af (Fig. 10B). Under Ce6 + LI (808 nm), the YAP level increased, which could be both suppressed by Af and Vp (Fig. 10C). Overall, these observations are consistent with those shown in Figs. 7 and 9. Silencing of HIF-1α and YAP by siRNA produced a further line of evidence of an HIF-1α-YAP interplay induced by PDA. Knock-down of HIF-1α and YAP both alleviated the nuclear co-localization of HIF-1α and YAP elicited by Ce6 + LI (808 nm) (Fig. 11A) and suppressed the induction of HIF-1α, YAP, and their downstream targets (Fig. 11B). Also, WST-8 assay (Fig. 11C) and cell surface annexin v assay (Fig. 11D) indicated that knock-down of HIF-1α and YAP both potentiated the photo-cytotoxicity of Ce6 + LI (808 nm) much like Af and Vp did (Fig. 6).
To recap, PDA elicited an interaction of HIF-1α and YAP which boosted their nuclear distribution and thereby increased the expression of their downstream targets. Af or Vp could block this interaction impacting both HIF-1α and YAP and potentiate the PDA-induced toxicity in the GBCs. In light thereof, we posited that the HIF-1α-YAP interaction might be part of the cellular response to PDA-inflicted cell damage, which is mobilized for damage repair and sustaining cell survival. Evidence is as follows.
Vp under LI (690 nm) and Ce6 under LI (808 nm) both stimulated an interplay of HIF-1α and YAP, which could be blocked by Vp or Af. A: Enhanced fluorescent co-localization of HIF-1α and YAP in the nucleus. CoCl2 was used as a control treatment. B&C: Co-immunoprecipitation (CO-IP) analysis indicated increased binding of HIF-1α and YAP, which effect could be both suppressed by Vp and Af
Knock-down of HIF-1α and YAP both prevented the interplay of HIF-1α and YAP stimulated by Ce6 under LI (808 nm) and potentiated the photo-cytotoxicity. Knock-down of HIF-1α and YAP both alleviated fluorescent co-localization of HIF-1α and YAP in the nucleus (A), decreased the expression of HIF-1α, VEGFA, YAP, and Survivin (B), and led to enhanced photo-cytotoxicity indicated by WST-8 assay (C) and surface annexin v staining (D). Values were means ± SD (n = 3, *p < 0.05, ***p < 0.001). Representative flow cytometry contour plots for D are shown in Fig. S10
PDA-elicited HIF-1α-YAP interaction resulted from DNA damage and led to upregulated DNA repair activity
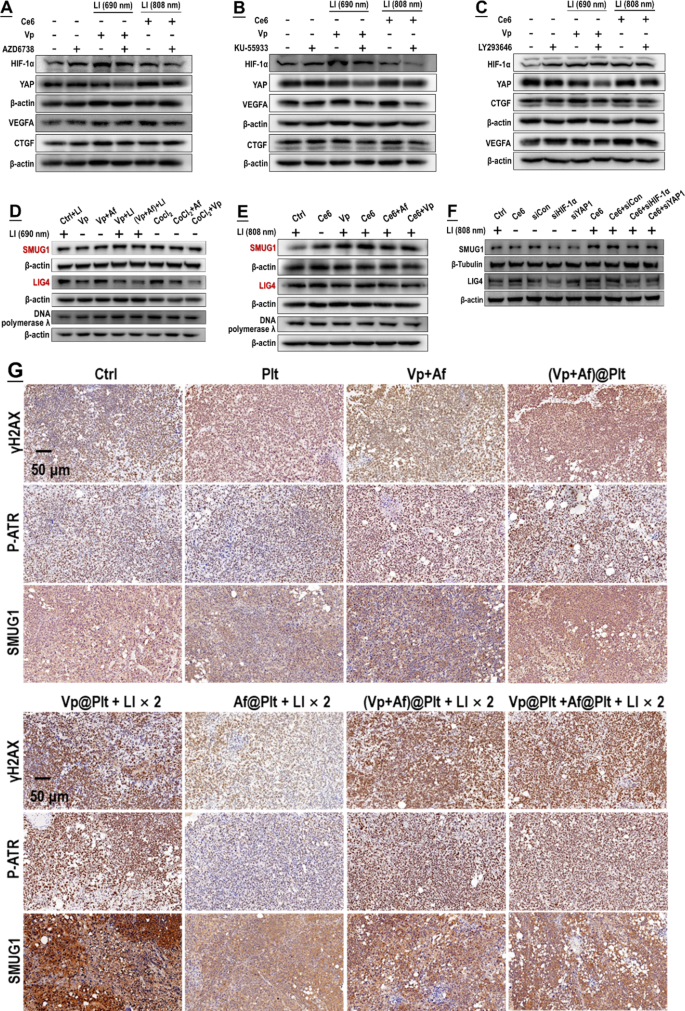
As pronounced DNA damage was identified following exposure to PDA (Fig. 2), we blocked the DNA damage response in PDA-exposed GBCs employing pharmacologic inhibitors of the ATR, ATM, and DNA-PK, which are major DNA damage sensors [44, 45]. As shown in Fig. 12A-C, inhibition of each of the 3 sensors could suppress the upregulation of HIF-1α and YAP and their downstream targets either induced by Vp + LI (690 nm) or Ce6 + LI (808 nm). On the other hand, SMUG1 and DNA ligase IV (LIG4) are key enzymes involved in nuclear DNA repair [46, 47]. Both Af and Vp markedly suppressed the induction of the two enzymes either caused by Vp + LI (690 nm), or Ce6 + LI (808 nm), or CoCl2 (Fig. 12D-E). Consistently, knock-down of HIF-1α and YAP both suppressed the induction of SMUG1 and LIG4 caused by Ce6 + LI (808 nm) (Fig. 12F). In short, the HIF-1α-YAP interaction was elicited for mobilization of DNA repair which could be both blunted by Af and Vp.
Induction of HIF-1α and YAP by PDA was a downstream event to DNA damage and led to upregulation of DNA damage repair activity. A–C: Pharmacological blocking of DNA damage sensors (i.e. ATR, ATM, and DNA-PK) alleviated induction of HIF-1α and YAP both caused by Vp under LI (690 nm) and Ce6 under LI(808 nm). AZD6738, KU-55,933, and LY293646 are inhibitors of the ATR kinase, ATM kinase, and DNA-PK, respectively. D&E: Both Af and Vp blocked induction of DNA repair enzymes (i.e. SMUG1 and LIG4) caused by Vp under LI(690 nm) or Ce6 under LI(808 nm). F: Knock-down of HIF-1α and YAP both prevented the induction of SMUG1 and LIG4 caused by Ce6 under LI(808 nm). G: Af delivered in the form of (Vp + Af)@Plt and Af@Plt + Vp@Plt both suppressed the induction of SMUG1 and LIG4 caused by Vp@Plt under LI(690 nm) and potentiated the DNA damage (indicated by γH2AX and P-ATR expression) in intracranial GBM tissues. Experimental protocol is shown in Fig. S4. Briefly, intracranial GBM-bearing mice were intravenously injected with Vp@Plt, Af@Plt, Vp@Plt + Af@Plt, or (Vp + Af)@Plt and, 2 h later, received 2 LI (690 nm, 0.5 W/cm2, 60 s) at the tumor site at a 2-hr interval. The animals were sacrificed 24 h after the 2nd LI. The brains were taken for IHC staining of γH2AX, P-ATR, SMUG1, and LIG4


