

There’s been lots of conversation about the recent boom in submarine cable construction. This flurry of activity becomes clearer when our annual map is viewed over time.
Today, we’re putting several years’ worth of maps back-to-back to visualize an evolving undersea network. (And to reminisce about some of our favorite designs, if I’m being honest.) Give each map a click for a larger interactive view.
2013 | An Antique Exploration
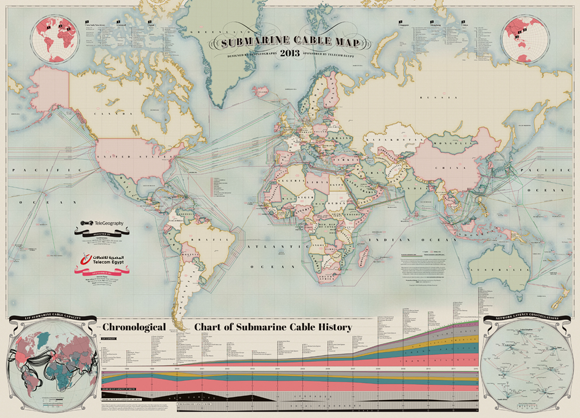
Years ago, our map detailed 232 lit cables and 12 that were anticipated to come online before 2014. The final design charted submarine cable history, chronicling network latency and submarine cable capacity.
2014 | Protectors of the Internet
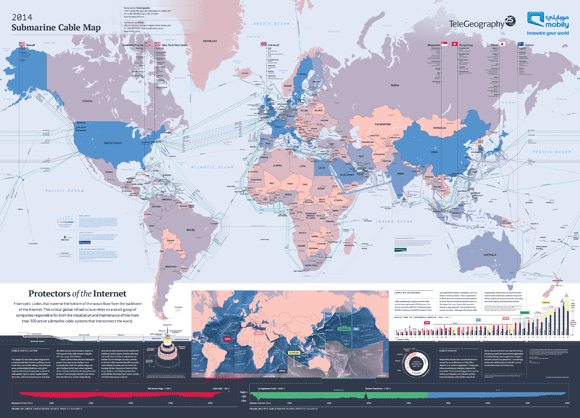
In 2014 we depicted 285 cable systems that were currently active or due to enter service by 2015, as well as the location of 44 cable laying vessels.
The “Protectors of the Internet” theme incorporated coverage of the companies that actually lay and maintain cables, with detailed information on cable faults and repairs, including the number of breaks and mean time to commence repair by country.
2015 | Sub Cables and Sea Monsters
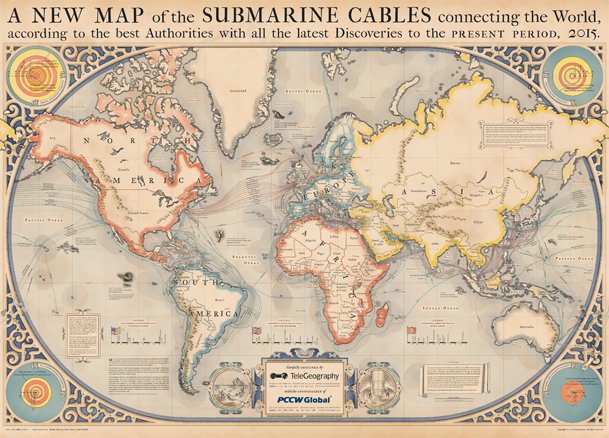
The next year, we encountered a few sea monsters alongside our annual lineup of submarine cables.
We charted 299 cables that were active, under construction, or would be funded by the end of 2015. (Vox even made a great undersea cable explainer using this map!)
2016 | 321 Cable Systems Strong
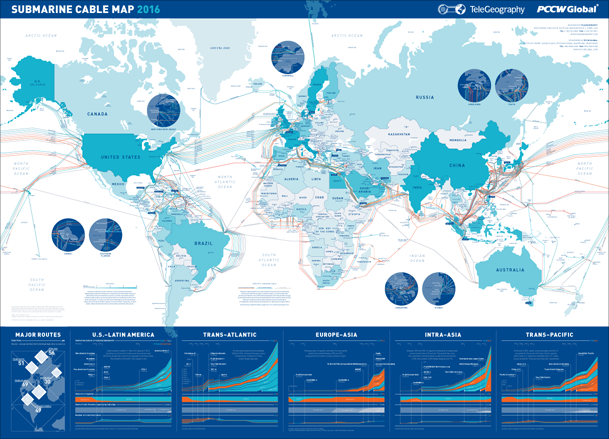
You could call 2016 our Blue Period.
We like to think of it as the year our map documented 321 cable systems. This edition also includes inset maps and infographics that are as data-rich as they are beautiful.
2017 | The Adventurer’s Map
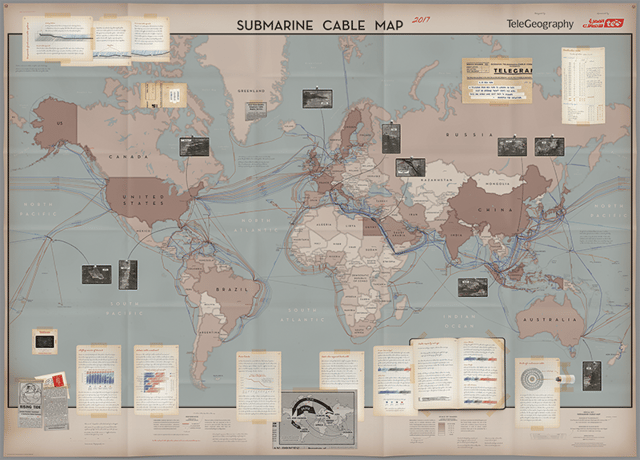
We wouldn’t blame you if you wanted to play the Indiana Jones theme in the background while you gaze at our 2017 map.
This edition borrowed design ideas from your favorite fictional archaeologist, including submarine cable facts as a collection of artifacts, journal entries, and hand-drawn sketches befitting of Indiana Jones.
2018 | Detailing 366 Systems
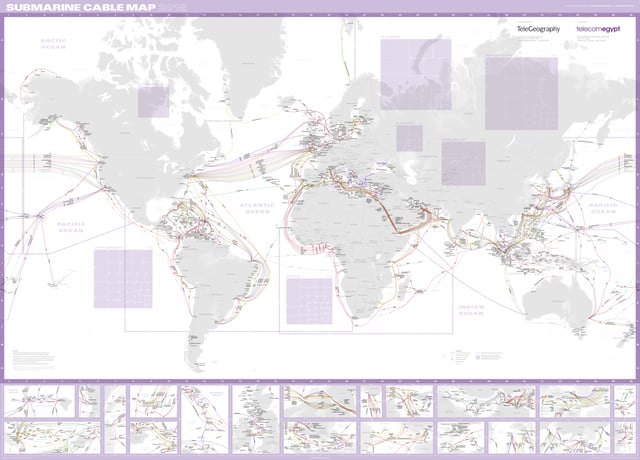
Our 2018 submarine cable map tracks 366 submarine cable systems and 1,006 landing stations that were active, under construction, or expected to be fully funded by the end of 2020. This purple projection has more detail than ever, charting fiber pairs, resiliency, and more.
2019 | The Building Boom

The 2019 edition is all about the building boom. Infographics single out the economics of new cables, investors, bandwidth demand, and—of course—a closer look at how content providers get involved.
Unlike previous submarine cable construction booms, companies like Amazon, Google, Facebook, and Microsoft are taking a more active role. These companies have incredible bandwidth demand for their data center traffic, which is driving projects and route prioritization for new cables.
2020 | A Rustic Throwback

Our 2020 edition arrived with a new interactive experience and free map downloads. This traditional, nostalgic design depicts 447 cable systems and 1,194 landing stations that were currently active, under construction, or expected to be fully funded by the end of 2022.
2021 | Shout-Out to the Sharks

Our 2021 Submarine Cable Map depicts 464 cables and 1,245 landing stations; 428 cables were active and 36 were planned when we released this candy-colored edition.
There were quite a few new graphics and FAQs to show off. This edition has trivia on cable suppliers, content providers, deployments, fiber, and more.
You’ll also find a new shark friend in the top right. You might have heard that sharks are known to bite cables, but bites like this haven’t accounted for a single cable fault since 2007. The majority of damage to submarine cables comes from human activity, such as fishing and anchoring.
2022 | And It Was All Yellow

Our 2022 Submarine Cable Map got up to 486 cable systems and 1,306 landing stations. It outlined:
- Construction Costs: Despite delays associated with the COVID-19 pandemic, new system spend rebounded in 2020 to $2.7 billion.
- Content Providers Using Capacity: Content providers’ international bandwidth growth outpaced that of all other customers. By 2017, content providers had surpassed internet backbone providers as the largest users of international capacity.
- Fiber Pairs: In the Atlantic, rising demand requirements are leading to a substantial increase in the fiber pair count per cable.
2023 | Windrose Networks

What has dashing good looks and depicts 529 cable systems and 1,444 landings? The 2023 Submarine Cable Map.
Looking closely, you’ll find sea monsters, ornate compass roses, and windrose networks woven in. Historically, a windrose network was a crucial navigational aid found on portolan charts and other early nautical schematics used during the medieval age and the Age of Exploration.
2024 | A Map Safari

We added a safari theme to our map repertoire with the 2024 Submarine Cable Map. This handsome edition explored global connectivity from the sea to the cloud, depicting 559 cable systems and 1,636 landing stations.
At the bottom of the map, you’ll find additional insights on cable construction, cable investments, and cloud infrastructure.
2025 | Going Dark

This futuristic, high-contrast 2025 design depicts 597 cable systems and 1,712 landings. For those keeping score, that’s 38 more cable systems and 76 more landings than the 2024 edition.
At the bottom of this map, we zero in on Networks of the Future with potential capacity, used capacity, and cable deployment stats for six major submarine cable routes: Trans-Pacific, U.S.–Latin America, Trans-Atlantic, Europe–Sub-Saharan Africa, Europe–Asia via Egypt, and Intra-Asia.
