Preparation and characterization of PEG-GVs
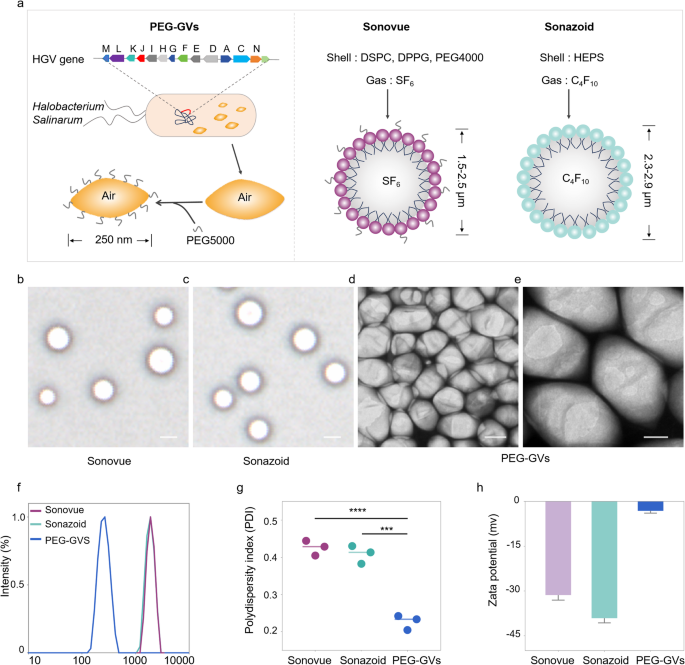
Unlike Sonovue and Sonazoid produced through chemical synthesis with lipid components and inert gases like sulfurhexafluoride (SF6) or perfluorobutane (C4F10), GVs are synthesized via a biological synthesis route. Generally, GVs are encoded by gvp gene clusters in the genome and assembled into gas-filled protein shells along with the growth of microorganisms. Firstly, we extracted GVs from Halobacterium Salinarum through lysis method as reported previously [24,25,26]. To reduce their immunogenicity to body, PEG5000 was subsequently conjugated onto the surface of GVs through amidation reaction in the presence of EDC and NHS, resulting in the formation of PEG-GVs (Fig. 2a, left panel). The structure and composition of PEG-GVs also diverge significantly from Sonovue and Sonazoid. PEG-GVs feature gvp protein shells and air core. In contrast, Sonovue is composed of DSPC/DPPG shells encapsulating an SF6 core, and Sonazoid predominantly consists of hydrogenated egg phosphatidyl serine (HEPS) shells with a C4F10 core (Fig. 2a, right panel) [27]. This structural disparity is also reflected in their morphological appearance. Under the microscope, Sonovue and Sonazoid both exhibit a spherical shape, while PEG-GVs display an ovary shape under the scanning electron microscope (SEM) (Fig. 2b-2e). The hydrodynamic size of the UCAs was also measured via dynamic light scattering (DLS). Notably, GVs and PEG-GVs are significantly smaller, with a mean hydrodynamic diameter of 213.60 ± 1.71 nm, 252.90 ± 3.08 nm, respectively (Figure S1), as opposed to Sonovue and Sonazoid which have particle sizes in the micrometer range: 2.18 ± 0.78 μm and 2.36 ± 0.95 μm, respectively (Fig. 2f). The polydispersity index (PDI) further differentiates these agents. The value of this index for PEG-GVs is 0.23 ± 0.02, which is substantially lower than that of Sonovue 0.43 ± 0.02 and Sonazoid 0.41 ± 0.02 (Fig. 2g). In our in vitro observation experiments, we also found that compared to Sonovue and Sonazoid, PEG-GVs exhibit superior dispersion characteristics and long-term stability (Figure S2). The zeta potentials of PEG-GVs, Sonovue, and Sonazoid are measured at -3.17 ± 0.78 mV, -31.38 ± 1.69 mV, and − 39.16 ± 1.55 mV, respectively (Fig. 2h). Thus, our results demonstrate that PEG-GVs have uniform nanoscale particle size and outstanding stability.
Preparation and characterization of PEG-GVs. (a) Composition and structure diagram of biosynthetic PEG-GVs, Sonovue and Sonazoid. b–c, the morphologies of Sonovue (b) and Sonazoid (c) observed under microscope. Scale bar: 2.5 μm. d–e, SEM images of PEG-GVs. Scale bar: 100 nm (d), 50 nm (e). f–h, Particle size distribution (f), PDI (g) and Zeta potential (h) of PEG-GVs, Sonovue and Sonazoid. *** p < 0.001, **** p < 0.0001
Acoustic characteristics and in vitro imaging of PEG-GVs
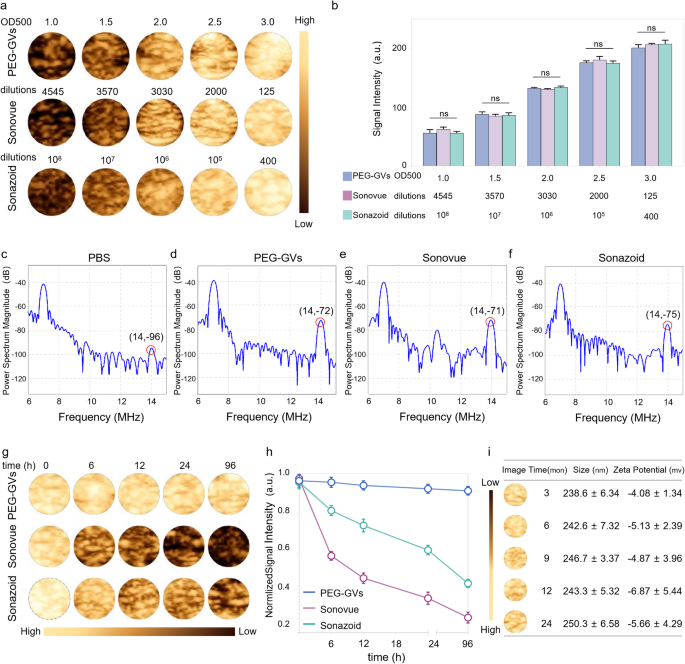
To facilitate comparison of PEG-GVs with Sonovue and Sonazoid in subsequent experiments, we first optimized the concentrations of PEG-GVs to achieve a comparable imaging intensity to Sonovue and Sonazoid. As depicted in Fig. 3a-3b, we can see that the CEUS imaging intensities of PEG-GVs at OD500 1.0, 1.5, 2.0, 2.5 and 3.0 were comparable with Sonovue at 4545-, 3570-, 3030-, 2000-, 125-fold dilutions and Sonazoid at 108-, 107-, 106-, 105-, 400-fold dilutions, respectively. Generally, nonlinear imaging modes depend on harmonic signals from microbubble or nanobubble oscillations excited by ultrasound waves, improving contrast specificity of CEUS. Especially, the second harmonic signals are crucial for CEUS imaging. Therefore, we compared the harmonic signal characteristics of PEG-GVs, Sonovue and Sonazoid. Transmitting at 7 MHz, we observed substantial second-harmonic signals in PEG-GVs at 14 MHz compared to PBS control. As expected, Sonovue and Sonazoid produced substantial second-harmonic signals at 14 MHz different from Sonazoid and PEG-GVs, Sonovue also produced ultraharmonic signals (3/2 f0) at 10.5 MHz (Fig. 3e). This phenomenon mainly arises from flexible and nonlinear deformable phospholipid shells and was also observed by other group [28]. Quantitative analysis showed the second harmonic signals of Sonovue, Sonazoid and PEG-GVs had 25.85 ± 1.70 dB, 22.57 ± 3.03 dB, and 24.00 ± 1.29 dB higher power spectrum magnitude than the PBS solution at the transmitted frequency (Figure S3). Notably, PEG-GVs produced comparable nonlinear second-harmonic signal intensities, similar with the commercial Sonovue, Sonazoid. To compare the imaging stability of these UCAs, PEG-GVs (OD500 3.0) and Sonovue and Sonazoid (at corresponding concentrations with comparable CEUS imaging intensities) were kept at 4 °C and imaged at different time intervals (Fig. 3g-h). The results showed that the contrast imaging intensity of Sonovue rapidly declined to below 50% in several hours and below 30% after 96 h, while that of Sonazoid declined more slowly but also dropped below 50% at 96 h. In stark contrast, PEG-GVs showed no significant signal decrease during the 96-h observation period (Fig. 3h). Additionally, it was also observed that Sonovue and Sonazoid significantly vanished over time, while the PEG-GVs largely retained their original signal intensity (Fig. 3g), indicating the excellent imaging stability of PEG-GVs relative to commercial Sonovue and Sonazoid. To further assess the long-term stability of PEG-GVs, we extended the observation period to 24 months and detected GVs’ imaging performance, particle size and zeta potential. We found that PEG-GVs still remained stable in imaging performance, particle size and zeta potential throughout 24-month observation period (Fig. 3i). These results indicate that PEG-GVs kept excellent CEUS imaging performance and robust stability, facilitating their biomedical application and long-term preservation.
Acoustic characteristics and in vitro imaging of PEG-GVs. a-b, In vitro nonlinear contrast imaging (a) and quantification (b) of PEG-GVs, Sonovue and Sonazoid at the different concentrations. c-f, In vitro nonlinear signal spectra of PBS solution (c), PEG-GVs (d), Sonovue (e) and Sonazoid (f). g-h, The contrast images (g) and quantification (h) of the three UCAs kept at 4°C for different time from 0 h to 96 h. i, In vitro nonlinear contrast imaging, particle size, and zeta potential of PEG-GVs kept at 4°C for 3, 6, 9, 12, 24 months.
In vivo CEUS imaging of PEG-GVs in normal liver tissue
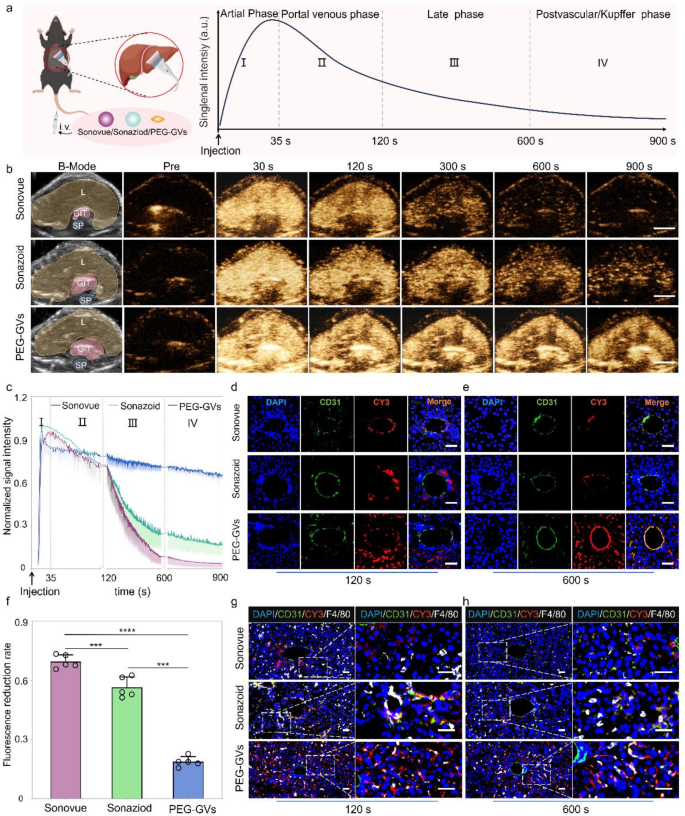
Based on the outstanding stability and imaging performance of PEG-GVs in vitro, we further compared the liver contrast imaging performance of PEG-GVs with Sonovue and Sonazoid in healthy C57BL/6J mice. The experimental process and phases of ultrasound contrast agent infusion are depicted in Fig. 4a, showing the typical contrast echo signal enhancement modes in the arterial phase, portal venous phase, late phase and postvascular phase (also called Kupffer phase for Sonazoid). To reduce individual differences, we intravenously administered these UCAs in the same mice at 30-min intervals, followed by a short high-power burst before next injection. As shown in Fig. 4b, the echo signals of liver received with Sonovue were enhanced in the arterial phase (30 s), subsided in the portal venous phase (120 s), and weakened rapidly after 300 s. Sonazoid has a prolonged imaging time in Kupffer phase and provides more details for liver disease diagnosis. Our results show that the liver echo signal of Sonazoid was significantly enhanced in the arterial phase (30 s), slightly reduced in the delayed phase (300 s), significantly decreased in the Kupffer phase (600 s), and becoming weak after 900 s. Interestingly, the liver echo with PEG-GVs remained stable across all phases, much stronger than Sonovue and Sonazoid, especially in the late and Kupffer phases (Fig. 4b). Quantitative data further revealed that the imaging intensity of Sonovue and Sonazoid declined rapidly subsequent to the portal phase (120 s), whereas PEG-GVs remained at a high level, with a decline rate of less than 20% in 600 s (Fig. 4f) and still less than 30% until 900 s (Fig. 4c). The normalized AUC (Area under curve) 900 s of PEG-GVs was greater than that of Sonazoid and Sonovue, being 2.72- times of Sonazoid and 1.82 times of Sonovue, respectively (Figure S4). Obviously, this prolonged imaging duration offers longer time for analysis, thereby leading to more precise diagnosis and efficient interventional operation for doctors.
CEUS imaging performance and mechanisms of PEG-GVs in normal liver. a, Diagram of normal liver CEUS and its four phases when imaging of liver in vivo, scale bar: 5 mm. b, The CEUS images of different phases in the same mice after systemic administration of Sonovue, Sonazoid and PEG-GVs at 30 min intervals. The “L”, “GIT”, “SP” represents liver, stomach and intestines, and spine on the B-mode images, respectively. c, The normalized signal intensity curves of CEUS images in Fig. 4b. d–f, Immunofluorescence images of vessels (stained with anti-CD31) and CY3-labeled UCAs at 120 s (d) and 600 s (e) after systemic administration. f, The quantification of fluorescence reduction rate in Fig. 4d. Scale bar: 40 μm. *** p < 0.001, **** p < 0.0001.(n = 5), g–h, Immunofluorescence images of liver tissues at 120 s (g) and 600 s (h) after systemic administration. Kupffer cells were stained with anti-F4/80 and UCAs were stained by CY3 dye. Scale bar: 40 μm.
To further elucidate the mechanisms underlying prolonged imaging duration, we performed immunofluorescence staining using CY3-labeled PEG-GVs and DIO-labeled Sonazoid and Sonovue. Immunofluorescence staining of liver sections revealed a considerable amount of PEG-GVs penetrated beyond blood vessels and achieved liver cells. In contrast, scarce Sonazoid and Sonovue could infiltrate blood vessels and settled around blood vessels. Notably, we witnessed the progressive adhesion of PEG-GVs to the vascular walls after systemic administration. Bubble adhesion was still observable at 120 s and annular adhesion to the entire blood vessel wall at 600 s after injection (Fig. 4d, 4e, Figure S5). This PEG-GVs’ adherence to the blood vessel walls could be observed for up to 1 h (Figure S6), which might partly explain their prolonged imaging duration of liver. Considering Sonazoid’s distinct advantage in the Kupffer phase as UCAs, we further investigated Kupffer cell uptake of different UCAs in liver tissue. Our findings revealed that Sonazoid and PEG-GVs, but not Sonovue, were conspicuously internalized by Kupffer cells at 120 s and 600 s. Moreover, the uptake of PEG-GVs elevated over time (Fig. 4g, 4h). Collectively, our data indicated PEG-GVs possesses outstanding CEUS capability in the liver, which may attribute to their adhesion and penetration beyond blood vessels and phagocytosis by Kupffer cells.
In vivo CEUS imaging of PEG-GVs in small liver tumor
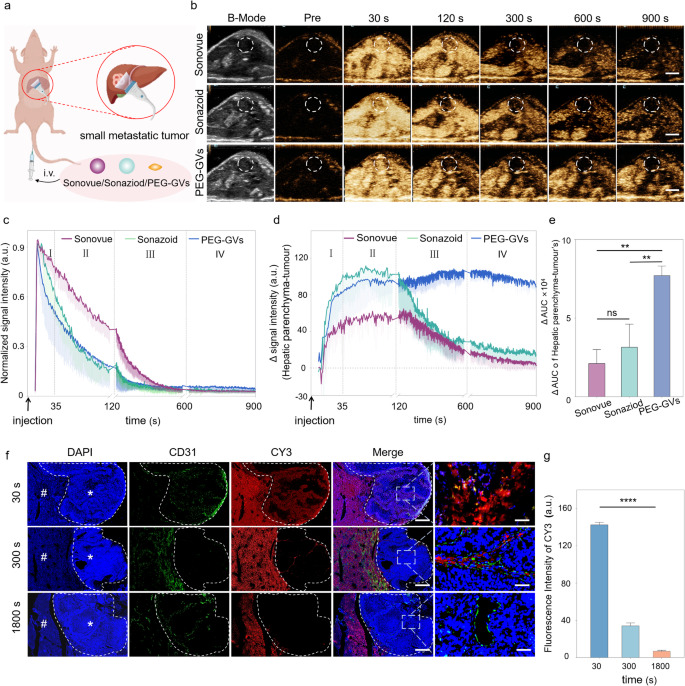
The Kupffer phase in liver CEUS has been demonstrated to enhance the detection rate and specificity of small liver tumor lesions [3, 29]. In light of the finding that Kupffer cells can phagocytose PEG-GVs, we hypothesized that they might play a significant role in the diagnosis of liver tumors. To test it, we employed a murine model of liver metastatic tumors to explore the possible value of PEG-GVs in detecting minuscule hepatic lesions (Fig. 5a). After the systemic administration, all the three UCAs exhibited rapid perfusion and rapid regression in the tumor (Fig. 5b-5c). Additionally, we observed a sustained high enhancement of PEG-GVs in the normal liver tissue, attributing to their vascular adhesion and Kupffer cell uptake as described above. Interestingly, PEG-GVs did not exhibit a sustained enhancement in liver tumor tissue due to EPR effects but regressed rapidly. This leads to a persistently lower imaging intensity of tumors relative to peripheral liver tissue, especially in the late phase and Kupffer phase (Fig. 5d). Quantitative analysis of tumor-subtracted hepatic parenchyma AUC revealed PEG-GVs had 3.62-fold and 2.44-fold higher than Sonovue and Sonazoid, respectively (Fig. 5e). The immunofluorescence results further confirmed that PEG-GVs did not accumulate in the tumor area over time but declined rapidly instead, while it scarcely decreased in the surrounding normal liver tissue. This might be attributed to the fact that PEG-GVs do not adhere to the vascular endothelium of tumor tissue, thereby failing to remain in the blood vessels for an extended period (Fig. 5f, Figure S7). Quantitative data also demonstrated that PEG-GVs in the tumor decreased to only 24.3% of peak intensity after 300 s of injection and less than 10% after 1800 s (Fig. 5g).
CEUS imaging performance and mechanism of PEG-GVs in liver tumor. a, Diagram of CEUS of three UCAs in small liver metastatic tumors. b, CEUS images of Sonovue, Sonazoid and PEG-GVs at different time points after systemic administration,scale bar: 5mm. c, The normalized signal intensity curves of tumors in Figure5b. d-e, CEUS signal intensity of peripheral liver tissue (d) and the quantification of AUC difference between the surrounding liver tissue and tumor at 900 s (e). f-g, Blood vessels immunofluorescence staining by anti-CD 31 (f) and quantification (g) of liver metastatic tumors at 30 s, 300 s, 1800 s after CY3-labeled PEG-GVs administration. # and * represent normal liver and tumor area, respectively. Scale bar: 1000 µm. **** p < 0.0001.
PEG-GVs are nanoscale with approximately 250 nm particle size while the endothelial space in neovascularized tumors is 380–780 nm, making them easily pass through the tumor vessel via the EPR effect [30, 31]. The imaging performance of PEG-GVs may help visualize the EPR process of these nanobubbles by ultrasound in a real time manner. Meanwhile, the rapid regression of PEG-GVs from liver tumor also challenges the traditional concept that the EPR effect causing from tumor leaky vessel does not necessarily prolong the retention time of nanoparticles in a tumor, at least for nanobubbles such as PEG-GVs. This unique phenomenon also renders it feasible for PEG-GVs to accurately define tumor boundaries, thereby facilitating early diagnosis. As for the mechanisms, the possible reasons might be attributed to the high permeability of tumor blood vessels, which endows these nanobubbles with higher penetrating capability into the tumor, but meanwhile it may also facilitate their easier washout from the tumor compared to the normal liver tissue. The structural defect of glycocalyx on the surface of tumor blood vessels may also contribute to the fast rapid regression of PEG-GVs from liver tumor [32, 33]. These results imply that PEG-GVs, based on their long-time retention in the normal liver and rapid regression in the tumor, can serve as an outstanding contrast agent in the diagnosis of early liver tumors and help to produce a distinct display of tumor boundaries. Moreover, we found that the enhanced contrast signal difference between the tumor and surrounding liver tissue can last up to 15 min (900s), which could be beneficial for imaging guided procedures such as minimally invasive treatments of liver tumors.
Role of PEG-GVs in guiding liver tumor RFA in vivo
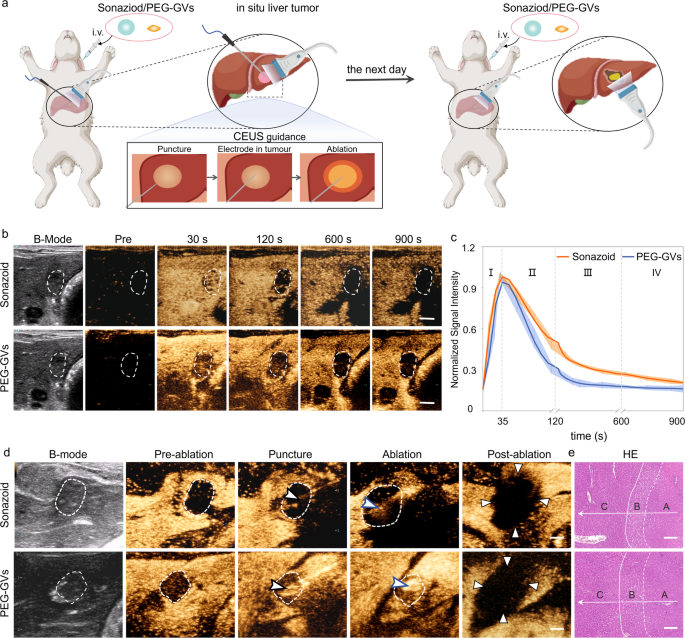
Given the great potential of PEG-GVs in ultrasound imaging of the liver and liver tumors, we further investigated their role in guiding radiofrequency ablation (RFA) in an in situ rabbit liver tumor model (Figure S8a). As is well known, the distinct display of tumor boundaries is essential for determining tumor ablation extent. However, the tumor boundaries usually cannot be clearly identified on grayscale ultrasound. In contrast, CEUS can precisely locate the lesion, guide the puncture, and promptly evaluate the therapeutic effect during ablation. Considering that Sonazoid has been widely used in guiding RFA ablation, we conducted a comparison between Sonazoid and PEG-GVs for guiding ablation of liver tumor [34, 35]. Sonazoid or PEG-GVs were administered intravenously to rabbits with orthotopic VX2 tumors and then performed the ultrasound-guided RFA, followed by a second administration next day (Fig. 6a). As illustrated in Fig. 6b, both PEG-GVs and Sonazoid exhibited a broader spectrum of tumors compared to their two-dimensional B-mode images. Notably, the tumor range displayed by PEG-GVs was even larger and remained durable over time. The normalized signal intensity curves indicated that both PEG-GVs and Sonazoid exhibited rapid perfusion and regression in early liver tumors (Fig. 6c). However, PEG-GVs retained in the surrounding liver tissue for a longer period, producing more distinct tumor boundaries. The tumor boundaries displayed by PEG-GVs make it more appropriate for guiding precise tumor ablation, especially for guiding punctures and observing the ablation range by ultrasound in a real-time manner, as depicted in Fig. 6d. HE staining clearly revealed normal liver tissue, peritumoral edematous liver tissue, and coagulated necrotic liver tumor tissue after RFA, indicating that complete ablation was achieved in both groups (Fig. 6e and Figure S8b). These results suggest that PEG-GVs plays a similar role to Sonazoid in guiding RFA of liver tumors.
Role of PEG-GVs in guiding RFA of liver tumor. a, Diagram of and CEUS-guided RFA treatment after administration of Sonazoid or PEG-GVs in rabbits in situ liver tumor. b–c, CEUS images in different phases of rabbits in situ liver tumor (b) and normalized signal intensity curves (c), (n = 5). Scale bar: 5 mm. d, B-mode ultrasound images of preoperative tumor, revealing the unclear tumor boundary (white dotted circles). The tumor boundary could be seen in CEUS image till the portal venous phase (white dotted circles). With the CEUS guidance, monitoring puncture, radiofrequency electrodes (black arrowheads) were easily inserted into the index tumor. The electrode needle was turned on and ablation were performed (blue arrowheads). The CEUS was repeated after RFA ablation. Triangle points to the area of non-enhancement in the early arterial phase, indicating a necrotic tumor immediately after RFA. (n = 3). Scale bar: 5 mm. e, HE staining of the ablated tissue. A, B, C stand for coagulated necrotic liver tumor after RFA, peritumoral edematous liver tissue and normal liver tissue, respectively (n = 3). Scale bar: 200 μm.
CEUS imaging and biosafety of PEG-GVs in macaque
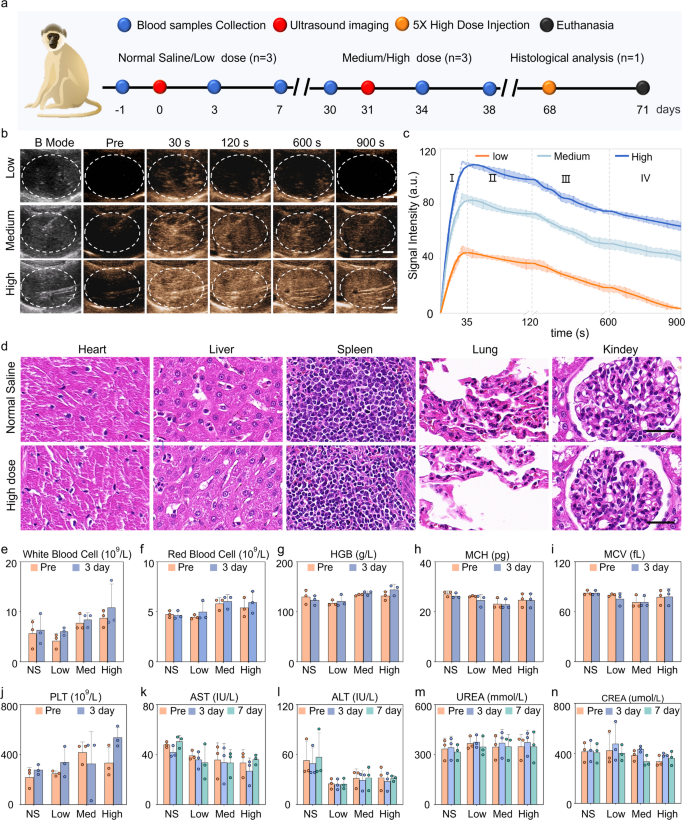
Macaques are highly similar to humans in terms of tissue structure, physiology, and metabolism. Hence, we further investigated the imaging performance of PEG-GVs in macaques. The experimental process is depicted in Fig. 7a. Figure 7b and c demonstrated that each dose of PEG-GVs may yield a rapid enhancement, reaching a peak about 35 s after systemic administration, then gradually decreased over time. With the increase of bubble doses, the contrast signal intensities increased and persisted for a longer duration. Notably, 15-min duration was exhibited for medium and high dose groups. Quantitative data indicated that the contrast signal intensities of three group at peak achieved 48.44 ± 3.70 a.u, 86.15 ± 3.11 a.u, 113.8 ± 3.66 a.u., respectively. It is worth noting that medium and high dose groups remained nearly half of the signal intensities after 900 s following the injection of PEG-GVs (Fig. 7c). To verify the in vivo biosafety of PEG-GVs, histological analysis of major organs and serum biochemical assays were conducted at the endpoint. HE staining data indicated that there was no significant damage to the heart, lung, kidney, and liver in the high dose macaque group (Fig. 7d), similar to the results obtained in mice (Figure S9). Tests of blood samples, including liver function, kidney function, and blood count, further indicated that PEG-GVs did not cause significant side effects (Fig. 7e-n, Figure S10). Therefore, PEG-GVs, as a novel ultrasound contrast agent, might hold broad prospects for future clinical applications.
Liver CEUS imaging and biosafety of PEG-GVs in macaque. a, Schematic diagram of biosafety assessment in macaques. b-c, CEUS images of macaque liver (b) and the signal intensity curves of the three ultrasonic agents in four phases (c). d, HE staining of major organs of macaques received with normal saline or high-dose PEG-GVs. e-n. Hematological detection of each index before and after systemic administration of normal saline or PEG-GVs.


