Preparation and characterization of engineered endoplasmic reticulum-targeting nanodrugs, CAQKERM@GsMTx4
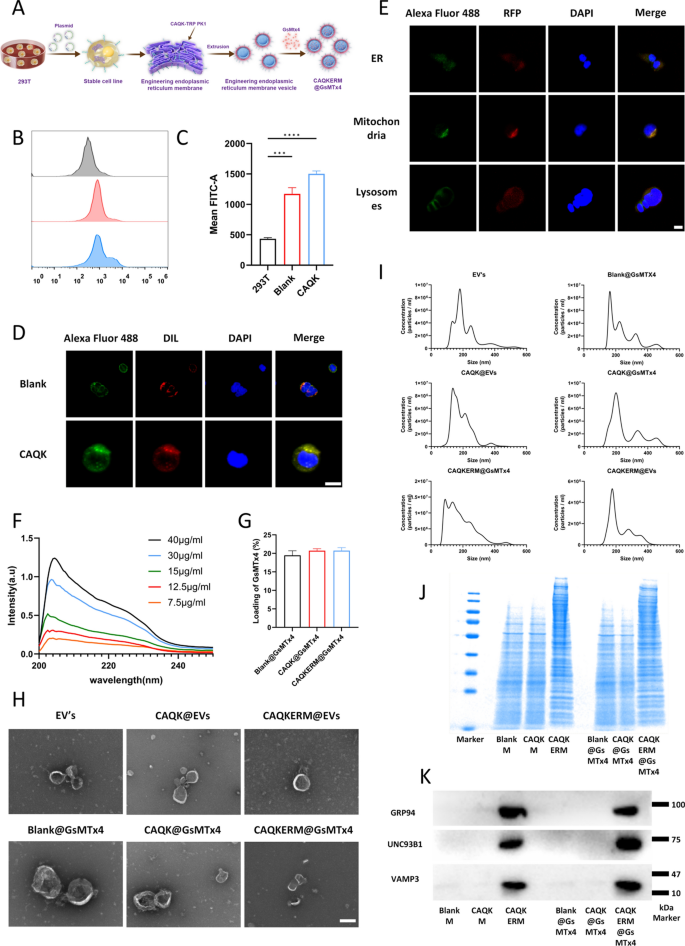
To develop an efficient targeted biomimetic nanodrug for the treatment of subarachnoid hemorrhage (SAH), we adopted the following strategy: CAQK-TRP-PK1 fusion peptides were displayed on the surface of nanovesicles prepared from the endoplasmic reticulum (ER) membrane, while the vesicle interior encapsulated the piezo1 inhibitor GsMTx4 (CAQKERM@GsMTx4). Initially, we constructed a DNA clone that enabled the effective expression of the CAQK-TRP-PK1 fusion peptide (Fig. S1). This construct was transfected into HEK293T cells, facilitating the expression and display of the CAQK-TRP-PK1 fusion peptide on both the plasma membrane and ER membrane. Vesicles were prepared by co-extruding the ER membrane and GsMTx4 through a liposome extruder, yielding artificial ER membrane vesicles loaded with GsMTx4 and displaying the CAQK-TRP-PK1 fusion peptide (CAQKERM@GsMTx4), designed to target hemorrhagic injury sites in the brain (Fig. 2A).
Characterization of CAQKERM@GsMTx4. A Schematic illustration of CAQKERM@GsMTx4 preparation. B Flow cytometry analysis showing Flag-tagged Blank and CAQK expression (Flag) in transfected and non-transfected HEK293T cells. C Quantification of the mean fluorescence intensity in B. D Confocal microscope pictures of CAQK showing up on the cell membrane of HEK293T cells that had Flag-tagged CAQK-expressing plasmid (CAQK) and Blank plasmid (Blank) added to them E Confocal microscopy images showing colocalization of CAQK (Alexa Fluor™ 488-conjugated) with markers for the endoplasmic reticulum, mitochondria, and lysosomes in CAQK-expressing HEK293T cells. F Standard curve for detecting GsMTx4 using a spectrophotometer. G GsMTx4 loading efficiency in different vesicles (n = 3). H Morphological characterization of EV’s, CAQK@EVs, CAQKERM@EVs, Blank@GsMTx4, CAQK@GsMTx4, and CAQKERM@GsMTx4 by TEM. Scale bar: 200 nm. I Size distribution analysis of EV’s, CAQK@EVs, CAQKERM@EVs, Blank@GsMTx4, CAQK@GsMTx4, and CAQKERM@GsMTx4 by nanoparticle tracking analysis. J SDS-PAGE and K Western blot analysis of membrane proteins
To verify this approach, a pCDH-CMV-MCS-EF1-Puro vector was engineered to express the CAQK targeting peptide sequence fused to TRP-PK1 at the N-terminus, with a flag tag on the C-terminus (pCDH-CAQK-TRP-PK1-flag plasmid). This construct has been previously shown to assist in integration into lipid bilayers. HEK293T cells transfected with the pCDH-CAQK-TRP-PK1-flag plasmid exhibited high levels of CAQK-TRP-PK1-Flag bound to the cell membrane, as confirmed by flow cytometry analysis (Fig. 2B, C). Confocal imaging showed that CAQK-TRP-PK1-Flag was found on the plasma membrane (Fig. 2D) as well as on the membranes of organelles, mainly the ER and mitochondrial membranes (Fig. 2E).
Previous studies have shown that functional proteins on the ER membrane play a critical role in enhancing cellular uptake and modulating intracellular protein levels. Therefore, we utilized a liposome extruder to prepare artificial ER membrane vesicles and drug-loaded vesicles from HEK293T cells expressing the CAQK-TRP-PK1 fusion protein. As controls, we prepared engineered artificial vesicles (CAQK@EVs, EV’s) and GsMTx4-loaded vesicles (CAQK@GsMTx4, Blank@GsMTx4) from cell membranes derived from HEK293T cells transfected with either pCDH-CAQK-TRP-PK1-flag plasmid or pCDH-TRP-PK1-flag plasmid. Freshly prepared EVs encapsulating GsMTx4 were quantified using UV spectrophotometry, with the characteristic absorbance peak of GsMTx4 identified at 204 nm. The standard curve was used to figure out the concentration of GsMTx4 when the GsMTx4 concentration was between 7.5 and 40 µg/mL (Fig. 2F, G). Transmission electron microscopy (TEM) pictures showed that all vesicles, including drug-loaded vesicles, had a spherical shape and a lipid membrane, which were similar with naturally released exosomes (Fig. 2H). Dynamic light scattering (DLS) analysis showed that the largest particles in the vesicles and drug-loaded vesicles were about 220 nm in diameter, which was about the same size as naturally released exosomes (Fig. 2I). We did a study using SDS-PAGE and western blot to look at the protein parts in the vesicles and drug-loaded vesicles. The results showed that the main protein parts of CAQKERM were still there in CAQKERM@GsMTx4, mainly UNC93B31 and GRP94 [31, 32], which are important ER membrane markers (Fig. 2K). Moreover, vesicle-associated membrane protein 3 (VAMP3) was found in both CAQKERM and CAQKERM@GsMTx4. VAMP3 was a member of the SNARE family and was involved in the movement of vesicles. The protein components retained in Blank@GsMTx4 and CAQK@GsMTx4 exhibited electrophoretic bands consistent with those of the plasma membrane [24].
In this study, proteomic techniques were employed to comparatively analyze proteins present in Blank cell membranes (BlankM), CAQK cell membranes (CAQKM), and CAQK endoplasmic reticulum membranes (CAQKERM). The results showed that compared with BlankM and CAQKM, CAQKERM exhibited significantly higher levels of vesicular transport proteins (Fig. S3A–B). HALLMARK, GO, KEGG, and REACTOME enrichment analyses revealed that CAQKERM had an upregulation of proteins in comparison with the control groups (Fig. S3C–D), and functional annotation based on the GO database (Fig. S4A–B) indicated that these upregulated proteins were classified into three main categories: “Cellular Component (CC),” “Molecular Function (MF),” and “Biological Process (BP),” suggesting that CAQKERM is enriched with functional proteins. Further enrichment analysis demonstrated that CAQKERM is rich in regulatory proteins capable of modulating various biological functions, including “Transport vesicle,” “Regulation of metabolic process,” “Metal ion transmembrane transporter activity,” and “Peptide binding”. Additionally, KEGG enrichment analysis explored the pathways involved in the upregulated proteins (Fig. S4C–D), showing associations with the endocrine system (“PPAR signaling pathway,” “Adipocytokine signaling pathway”), protein folding and degradation (“Protein export,” “SNARE interactions in vesicular transport”), signal transduction (“Wnt signaling pathway,” “MAPK signaling pathway”), and lipid metabolism (“Glycerophospholipid metabolism,” “Steroid biosynthesis,” “Biosynthesis of unsaturated fatty acids”). In comparison with BlankM and CAQKM, CAQKERM is enriched with more inflammation-related regulatory proteins, such as GPX8, GRP78, V-ATPase, SIGMAR1, FAM134B, RTN3 and others (Fig. S5A–B) [26, 33,34,35,36,37]. This may contribute to a more synergistic interaction between the drug-loaded delivery system constructed with CAQKERM and the GsMTx4.
Overall, our findings show that CAQKERM was full of functional proteins which played an important role in many physiological processes and signalling pathways. These results elucidated its potential utility as a drug delivery platform.
Immunomodulatory, neuroprotective, ROS scavenging, and cellular uptake of CAQKERM@GsMTx4 in vitro
The mechanism of SAH encompasses excitotoxicity and excessive production of reactive oxygen species (ROS) due to the abrupt bleeding, leading to the death of numerous neurons in the affected area [38]. Damage-associated molecular patterns (DAMPs) released by dying neurons activate microglia, promoting their polarization into the pro-inflammatory M1 phenotype. This leads to the release of pro-inflammatory cytokines, such as TNF-α, IL-1β, and IL-6, which exacerbate neuronal damage and contribute to secondary injury [39,40,41,42]. Therefore, effectively repairing damaged neurons, reducing ROS production, and promoting the polarization of microglia toward the anti-inflammatory M2 phenotype are anticipated to enhance tissue repair and facilitate the recovery of neurological function, offering a substantial therapeutic advantage.
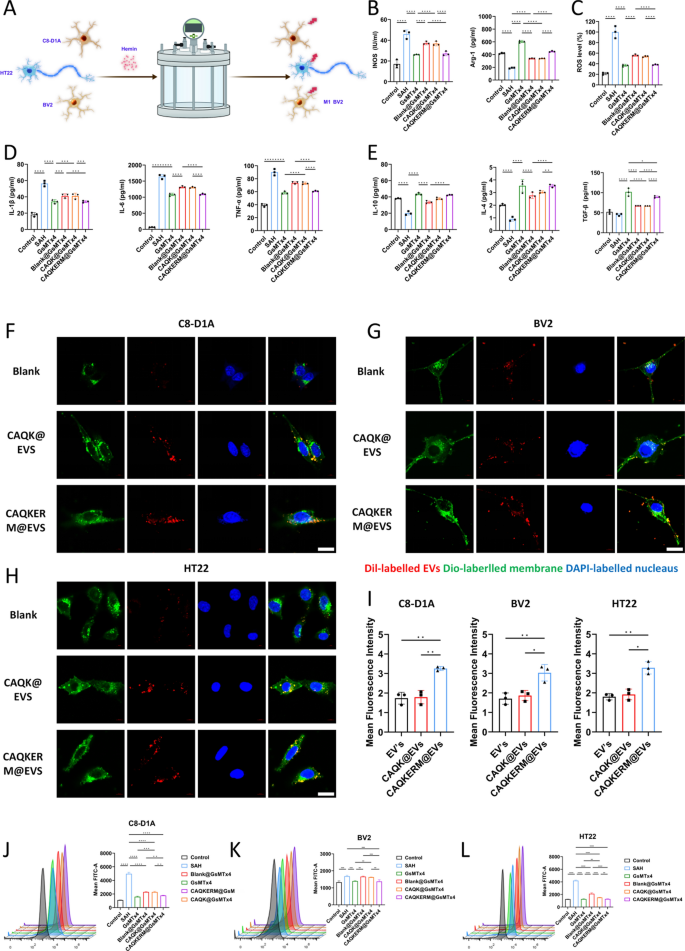
To evaluate the anti-inflammatory effects of CAQKERM@GsMTx4, we developed a pressure-blood infusion device to simulate intracranial hemorrhage conditions (Fig. 3A). Previous studies have shown that intracranial pressure peaks at approximately 15 kPa following SAH in mice. We initially tested the device for air-tightness to ensure the maintenance of a stable hypertensive environment (Fig. S2).
The treatment effectiveness and targeting efficiency of CAQKERM@GsMTx4 in vitro. A A drawing of the pressure device. B Measuring the amount of M1 and M2 macrophage markers present in BV2 cells that are activated by blood and pressure. The amount of ROS in the fluid around BV2 cells that are activated by blood and pressure (C). Findings of D cytokines that cause inflammation and E cytokines that stop inflammation in the fluid around BV2 cells that have been activated by blood and pressure. F–H Confocal microscopy images and I fluorescence density analysis of DiI-labeled EV’s, CAQK@EVs, or CAQKERM@EVs uptake by C8-D1A, BV2, and HT22 cells after 2 h of incubation. Scale bar: 10 µm. Flow cytometry analysis of Piezo1 protein expression in J C8-D1A, K BV2, and L HT22 cells. For all experiments, data are presented as mean ± SD for n = 3 biological replicates. * p < 0.05, ** p < 0.01, or *** p < 0.001
BV2 microglial cells were exposed to stimulation in the device for 24 h, followed by co-incubation with GsMTx4, Blank@GsMTx4, CAQK@GsMTx4, or CAQKERM@GsMTx4 for an additional 24 h. Macrophage markers and inflammatory cytokines were subsequently analyzed. Compared to untreated cells, pressure-blood-treated BV2 cells exhibited significantly higher levels of inducible nitric oxide synthase (iNOS), a classical M1 marker (Fig. 3B), along with elevated levels of TNF-α, IL-1β, and IL-6 (Fig. 3D), while the anti-inflammatory cytokine IL-4 was markedly reduced (Fig. 3E). Treatment with the drugs or drug-loaded vesicles significantly lowered the levels of iNOS, ROS, and pro-inflammatory cytokines (Fig. 3B–D). Notably, CAQKERM@GsMTx4 demonstrated anti-inflammatory effects comparable to direct drug administration, significantly upregulating IL-4, IL-10, TGF-β, and the M2 marker Arg-1 [43] (Fig. 3B, E). Cellular uptake capacity is essential for an optimal drug delivery system. To evaluate this, we labeled EV’s, CAQK@EVs, and CAQKERM@EVs with 1,1′-dioctadecyl-3,3,3′,3′-tetramethylindocarbocyanine perchlorate (DiI; red fluorescence) and incubated them with C8-D1A, BV2, and HT22 cells that had been pre-treated for 24 h using a pressurized perfusion device. The cells were then incubated for an additional 4 h. Confocal microscopy analysis revealed that DiI-labeled CAQKERM@EVs were highly enriched in cells within the brain hemorrhage model (Fig. 3F–I). These findings indicate that endoplasmic reticulum membrane-based vesicles demonstrate superior uptake efficiency in neural cells following brain hemorrhage injury. Additionally, extended incubation of CAQKERM@EVs with these injured neural cells for 12 and 24 h showed sustained vesicle accumulation in the damaged cells (Figs. S6, S7).
We subsequently investigated the inhibition of Piezo1 in vitro using drug-loaded vesicles. Neuronal cells subjected to various types of damage, simulated by pressure-driven blood perfusion, were treated with the drug-loaded vesicles. Compared to cells exposed to the pressure device alone, treatment with both the drug and drug-loaded vesicles significantly reduced the abnormal activation of Piezo1 induced by the pressure device. Notably, CAQKERM@GsMTx4 produced effects comparable to direct drug administration (Fig. 3J–L). These results suggested that CAQKERM@GsMTx4 mitigated inflammation by inhibiting Piezo1 and CAQKERM@EVs were efficiently absorbed by cells. The combination of these strategies showed great potential for achieving optimal therapeutic outcomes in vivo.
CAQKERM@GsMTx4 efficiently targeted the subarachnoid hemorrhage
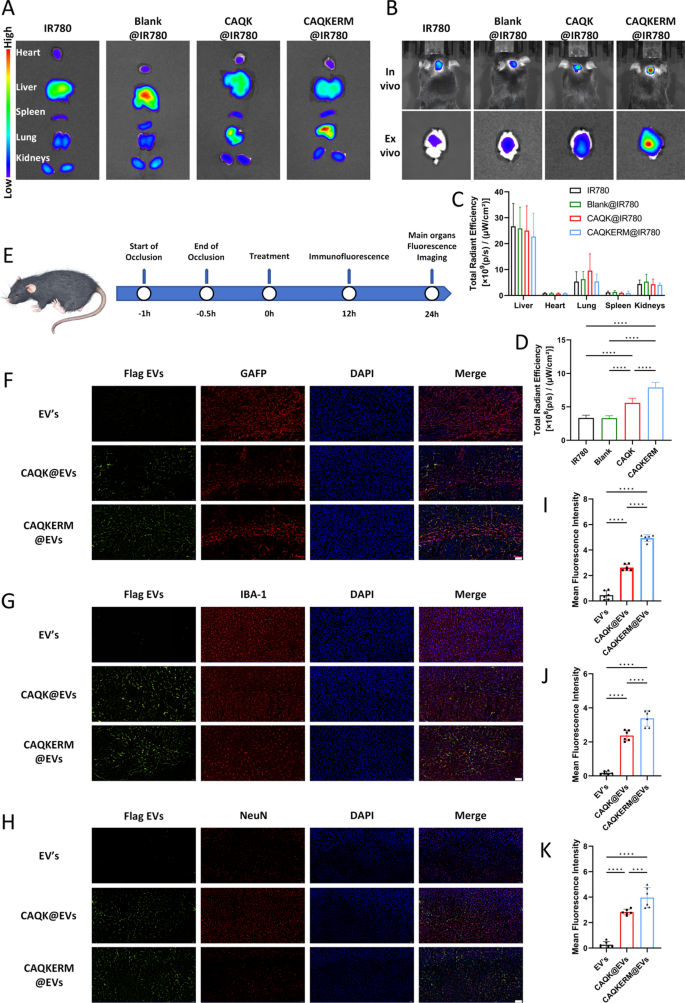
To investigate the targeting capability of engineered vesicles for hemorrhagic lesions, vesicles loaded with IR780 (Blank@IR780, CAQK@IR780, and CAQKERM@IR780) were intravenously administered into subarachnoid hemorrhage (SAH) model mice, followed by immunofluorescence staining to observe vesicle infiltration in the infarcted brain tissue (Fig. 4E). As shown in Fig. 4B, fluorescence signals were significantly enhanced in the brain tissue of mice treated with CAQKERM@IR780, with a signal intensity 2.38 times higher than that of the IR780 group (Fig. 4D). No significant differences in biodistribution were observed between the two groups outside of the brain tissue (Fig. 4A, C). The reason for the higher fluorescence intensity in the liver may be due to the natural accumulation of nanovesicles injected intravenously in the liver tissue, which is a common phenomenon in studies of various nanoparticle treatments for diseases.
Targeting capacity of CAQKERM@GsMTx4. A In vivo and ex vivo imaging of IR780, Blank@IR780, CAQK@IR780, and CAQKERM@IR780 in the hemorrhagic brain of SAH mice 24 h post-injection. B Semi-quantification of IR780, Blank@IR780, CAQK@IR780, and CAQKERM@IR780 in the brain based on IR780 fluorescence intensity. C Ex vivo imaging of IR780, Blank@IR780, CAQK@IR780, and CAQKERM@IR780 in the heart, liver, spleen, lungs, and kidneys 24 h post-injection. D Semi-quantification of IR780, Blank@IR780, CAQK@IR780, and CAQKERM@IR780 in these organs based on IR780 fluorescence intensity. E Time course of in vivo targeting studies. F–H Colocalization of Flag EVs with different cell types. Brain sections were stained with antibodies for different cell types, followed by secondary antibody (488, green) staining. Nuclei were stained with DAPI (blue). Scale bar: 50 µm. I–K Fluorescence density analysis. For all experiments, data are presented as mean ± SD for n = 6 biological replicates. * p < 0.05, ** p < 0.01, or *** p < 0.001
To further evaluate the uptake of modified vesicles by different types of brain cells, brain tissue sections were stained with antibodies recognizing neurons (NeuN), microglia (IBA1), and astrocytes (GFAP). As illustrated in Fig. 4F–J, the green fluorescence of engineered vesicles colocalized with the magenta fluorescence of NeuN (Fig. 4F), IBA1 (Fig. 4G), and GFAP (Fig. 4H). This indicates that the engineered vesicles were broadly distributed within neurons, microglia, and astrocytes in mouse brain tissue, with high fluorescence intensity observed (Fig. 4I–K). These findings demonstrate that intravenously administered modified vesicles accumulate extensively in the brain parenchyma and subsequently localize to neurons, microglia, and astrocytes.
CAQKERM@GsMTx4 reversed pro-inflammatory microenvironment, enhanced neuroprotection, and ROS scavenging
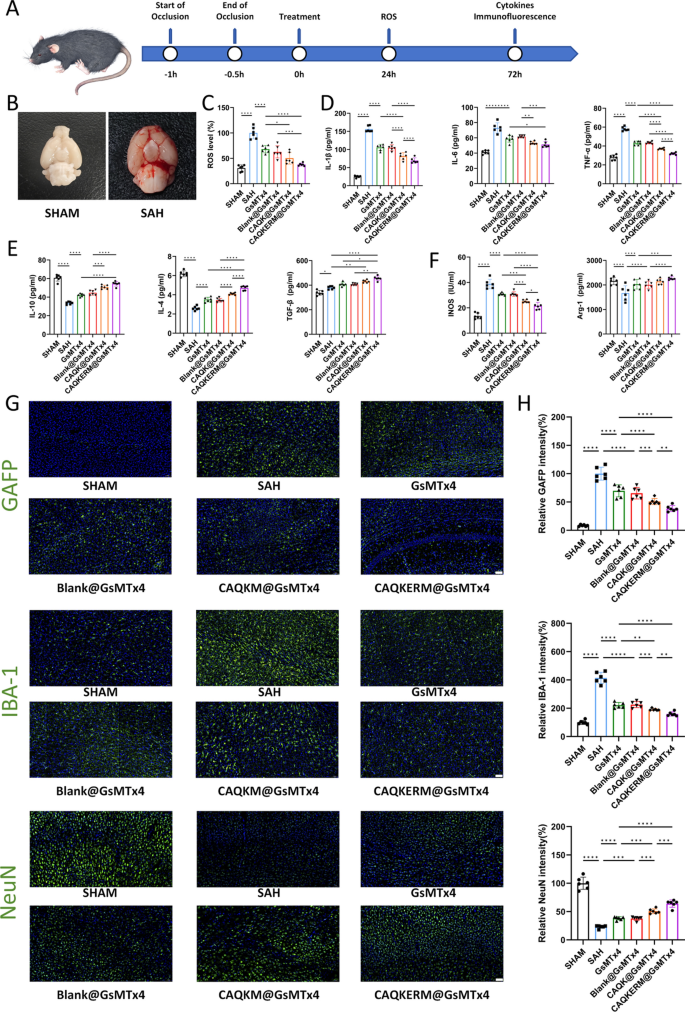
To evaluate the therapeutic effects of engineered endoplasmic reticulum membrane nanomedicine (CAQKERM@GsMTx4), tail vein injections of CAQKERM@GsMTx4 were administered to SAH mice (Fig. 5A). At 72 h post-treatment, protein expression levels of M1 and M2 markers, along with inflammatory cytokines in the right hemisphere of the brain, were assessed (Fig. 5B). As shown in Fig. 6D–F, levels of IL-1β, IL-6, TNF-α (Fig. 5D), and iNOS (Fig. 5F) were significantly reduced in mice treated with CAQKERM@GsMTx4 compared to those treated with GsMTx4, Blank@GsMTx4, or CAQK@GsMTx4. In contrast, levels of IL-10, IL-4, TGF-β (Fig. 5E), and Arg-1 (Fig. 5F) were notably higher. Furthermore, in the right hemisphere, expression of Iba1 (a marker of microglial activation) and GFAP (a marker of astrocyte activation, indicative of CNS pathology) [44, 45] was lower in the CAQKERM@GsMTx4 group (Fig. 5G). Fluorescence quantification revealed that Iba1 and GFAP levels in the CAQKERM@GsMTx4 group were only 38.54% and 38.35%, respectively, compared to the model group (Fig. 5H). These findings indicate that CAQKERM@GsMTx4 provides superior anti-inflammatory effects following SAH.
Therapeutic effects of CAQKERM@GsMTx4 in the SAH brain. A Experimental timeline. B Representative images of brain ROS levels in sham and SAH mice 24 h post-injury. C ROS levels in the right hemisphere of SAH mice 24 h post-treatment. Measurement of D pro-inflammatory and E anti-inflammatory cytokines in the right hemisphere of SAH mice. F Quantification of M1 and M2 macrophage markers in the right hemisphere. G Representative fluorescent images of microglia (Iba1), glial scar (GFAP), and neurons (NeuN) in infarct areas across groups 3 days post-treatment. Scale bar: 50 µm. H Fluorescence intensity of Iba1, GFAP, and NeuN corresponding to G. For all experiments, data are presented as mean ± SD for n = 6 biological replicates. * p < 0.05, ** p < 0.01, or *** p < 0.001
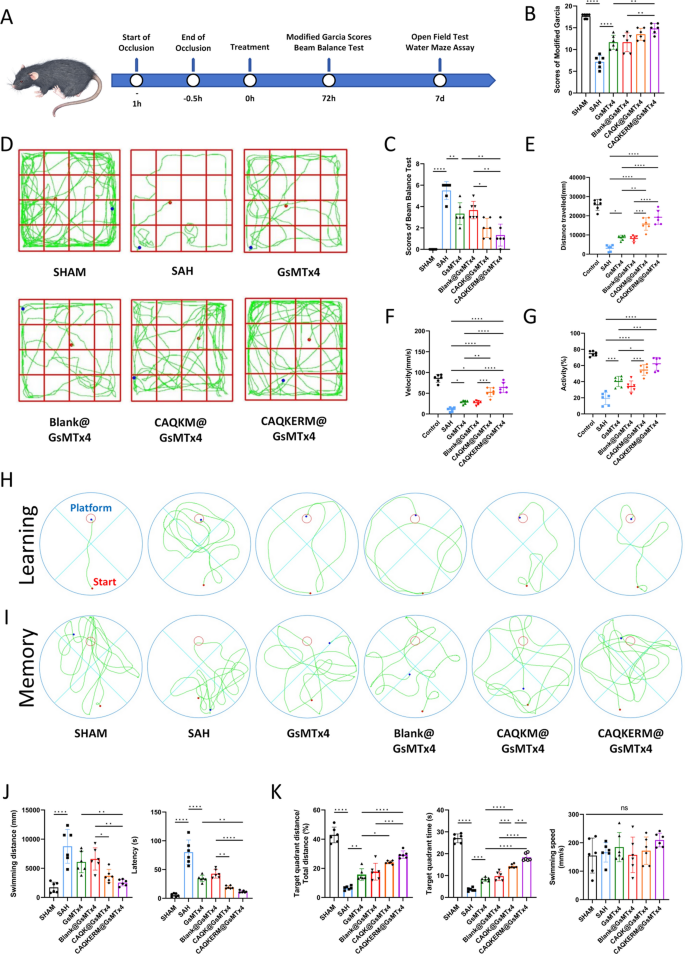
Neurobehavioral recovery of SAH mice. A Experimental timeline. Neurological scores assessed by B modified Garcia scale and C beam balance test at 24 h post-SAH. D Representative mouse paths in the open field test. E–G Open field test measuring disease-related behavioral parameters in SAH mouse models. Representative swimming paths of mice indicating their H learning and I memory abilities as determined by the Morris water maze test. J,K Disease-related behavioral parameters measured by the Morris water maze test in SAH mouse models. For all experiments, data are presented as mean ± SD for n = 6 biological replicates. * p < 0.05, ** p < 0.01, or *** p < 0.001
Additionally, ROS production in the right hemisphere was measured 24 h post-treatment. CAQKERM@GsMTx4 significantly reduced ROS levels (Fig. 5C). The role of CAQKERM@GsMTx4 in preserving tissue in the infarcted region was also assessed. At 72 h post-treatment, tissue staining for the neuronal marker NeuN was conducted. Immunofluorescence analysis demonstrated that CAQKERM@GsMTx4 treatment substantially alleviated tissue damage. Overall, CAQKERM@GsMTx4 exhibited pronounced neuroprotective effects and effectively reduced ROS levels, outperforming GsMTx4, Blank@GsMTx4, and CAQK@GsMTx4. This superior therapeutic outcome is likely attributed to CAQKERM@GsMTx4’s enhanced targeting and absorption in the lesion area of the right hemisphere post-hemorrhage. In contrast, GsMTx4 and Blank@GsMTx4 showed lower accumulation (Fig. 4B), and CAQK@GsMTx4 exhibited slower uptake, limiting its efficacy.
CAQKERM@GsMTx4 treatment enhanced post-stroke functional recovery
In vivo behavioral assessments were performed to evaluate the therapeutic efficacy of CAQKERM@GsMTx4 (Fig. 6A). SAH significantly impaired sensorimotor function, as indicated by reduced Garcia scores (Fig. 6B) and diminished performance in the beam balance test (Fig. 6C). Treatment with CAQKERM@GsMTx4 demonstrated potential in promoting neurological recovery (Fig. 6B, C), suggesting its neuroprotective effects on hemorrhagic brain injury. In the open field test (Fig. 6D), mice treated with CAQKERM@GsMTx4 exhibited greater total movement distance (Fig. 6E), speed (Fig. 6F), and activity levels (Fig. 6G) on day 7 post-SAH compared to other treatment groups. These findings indicate that CAQKERM@GsMTx4 effectively improves neurological function in SAH mice.
To further assess learning ability and spatial memory, we conducted the Morris water maze (MWM) test on SAH mice following various treatments. On day 7 post-SAH, representative swimming paths were recorded (Fig. 6H, I), revealing significant impairments in learning and spatial memory in SAH-treated mice. By the final day of the learning phase, the swimming paths showed that SAH mice treated with CAQKERM@GsMTx4 reached the platform via the shortest route (Fig. 6H), indicating reduced neurological damage compared to other groups (Fig. 6J). After platform removal, SAH mice traveled shorter distances and spent less time in the target quadrant compared to sham-operated mice, indicating impaired spatial memory. However, treatment with GsMTx4 and drug-loaded vesicles significantly improved spatial memory, increasing both distance traveled and time spent in the target quadrant (Fig. 6K). Swimming speed remained consistent across groups during the MWM test (Fig. 6K). These results demonstrate that CAQKERM@GsMTx4 contributes to behavioral recovery.
Study on molecular mechanisms
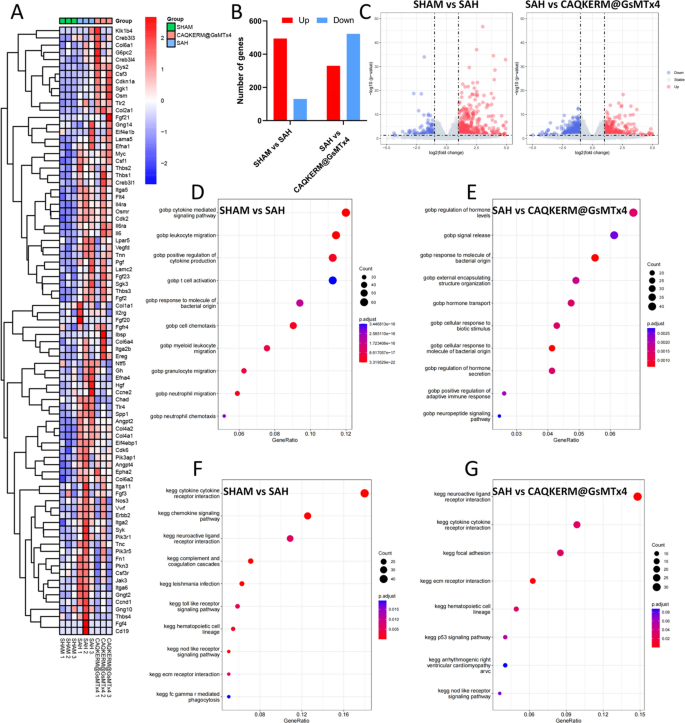
To elucidate the molecular mechanisms underlying the therapeutic effects of CAQKERM@GsMTx4 in treating SAH, we performed whole-genome RNA sequencing on SAH brain tissues 24 h post-treatment. We identified a total of 17,990 gene transcripts, including 605, 183, and 306 transcripts that were exclusively expressed in the sham, SAH, and CAQKERM@GsMTx4 groups, respectively (Fig. S8). Compared to the SAH group, the sham group exhibited 1407 differentially expressed genes (DEGs), with 759 upregulated genes (red dots) and 648 downregulated genes (blue dots). In the CAQKERM@GsMTx4 group, 852 DEGs were identified, comprising 330 upregulated and 522 downregulated genes (Fig. 7B–C).
RNA-seq analysis of SAH brain tissues after different treatments. A Heatmap of DEGs clustered after different treatments. B Summary of DEGs in SAH brain samples 24 h after different treatments. In C, volcano plots of DEGs are used to make different comparisons. D,E A GOBP enrichment study of pathways in the SAH group and the other treatment groups. F,G A KEGG pathway study of the pathways that were more active in the treatment groups compared to the SAH group
Gene Ontology Biological Process (GOBP) analysis (Fig. 7D–E) and cnetplot visualization (Fig. S9) demonstrated that CAQKERM@GsMTx4 modulated pathways related to hormone level regulation, signal release, hormone transport, cellular response to biological stimuli, regulation of hormone secretion, positive regulation of adaptive immune response, and neuropeptide signaling pathways compared to the SAH group. Additionally, Kyoto Encyclopedia of Genes and Genomes (KEGG) pathway enrichment analysis of DEGs (Fig. 7F–G) and cnetplot visualization (Fig. S10) revealed that CAQKERM@GsMTx4 influenced several key signaling pathways, including cell adhesion, the p53 signaling pathway, the NOD-like receptor signaling pathway, neuroactive ligand-receptor interactions, and cytokine-cytokine receptor interactions. These pathways align with the neuroprotective and anti-inflammatory mechanisms observed in both in vivo and in vitro studies [46]. Moreover, hierarchical clustering analysis of DEGs revealed distinct gene expression patterns across different treatment groups, highlighting molecular-level changes induced by CAQKERM@GsMTx4 (Fig. 7A).
Engineered endoplasmic reticulum membrane vesicles demonstrate excellent biosafety
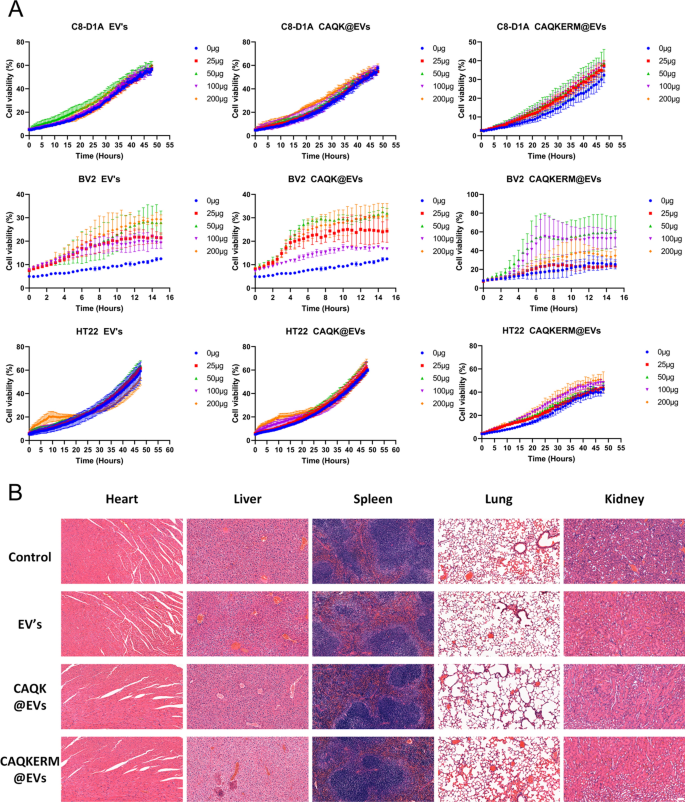
Finally, the biosafety of the engineered endoplasmic reticulum membrane vesicles was thoroughly evaluated. Incucyte analysis confirmed that EV’s, CAQK@EVs, and CAQKERM@EVs did not negatively impact the viability of C8-D1A, BV2, or HT22 cells (Fig. 8A), demonstrating a lack of cytotoxicity. Notably, no adverse effects were observed in the heart, liver, spleen, lungs, or kidneys of mice treated with EV’s, CAQK@EVs, or CAQKERM@EVs (Fig. 8B). These results highlight the excellent biocompatibility of our engineered apolipoprotein vesicles.


